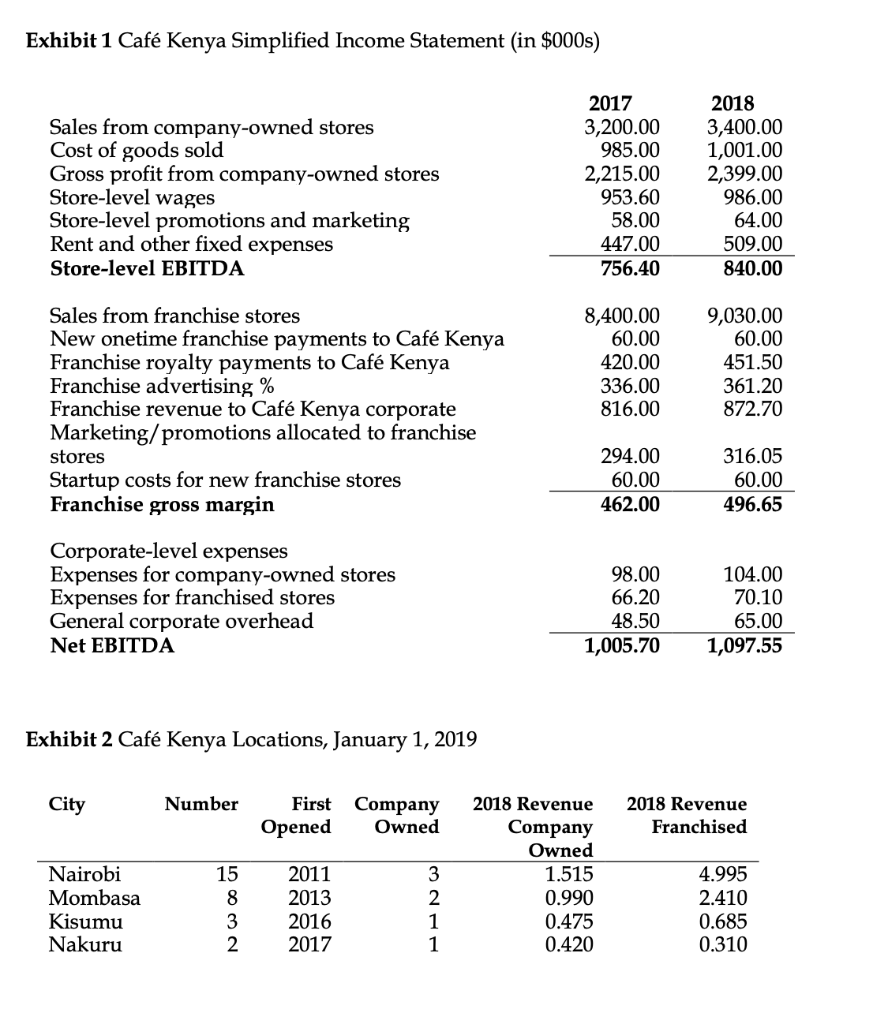
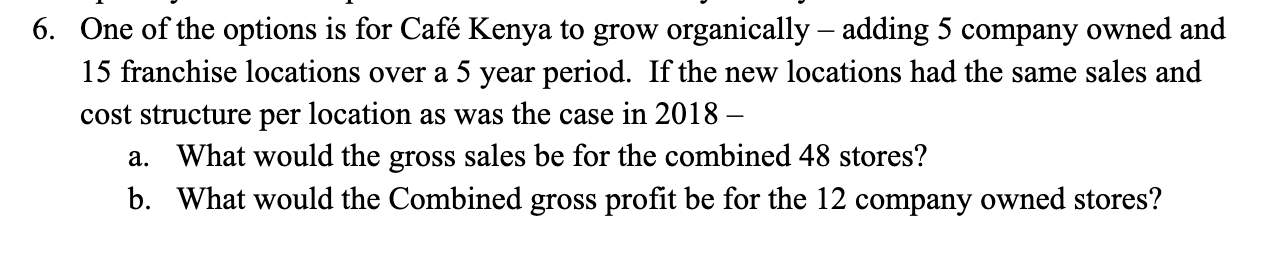
Exhibit 1 Caf Kenya Simplified Income Statement (in $000s) Sales from company-owned stores Cost of goods sold Gross profit from company-owned stores Store-level wages Store-level promotions and marketing Rent and other fixed expenses Store-level EBITDA 2017 3,200.00 985.00 2,215.00 953.60 58.00 447.00 756.40 2018 3,400.00 1,001.00 2,399.00 986.00 64.00 509.00 840.00 Sales from franchise stores New onetime franchise payments to Caf Kenya Franchise royalty payments to Caf Kenya Franchise advertising % Franchise revenue to Caf Kenya corporate Marketing/promotions allocated to franchise stores Startup costs for new franchise stores Franchise gross margin 8,400.00 60.00 420.00 336.00 816.00 9,030.00 60.00 451.50 361.20 872.70 294.00 60.00 462.00 316.05 60.00 496.65 Corporate-level expenses Expenses for company-owned stores Expenses for franchised stores General corporate overhead Net EBITDA 98.00 66.20 48.50 1,005.70 104.00 70.10 65.00 1,097.55 Exhibit 2 Caf Kenya Locations, January 1, 2019 City Number First Company Opened Owned 2018 Revenue Franchised Nairobi Mombasa Kisumu Nakuru 15 8 3 2 Nw0 GT 2011 2013 2016 2017 3 2 1 1 2018 Revenue Company Owned 1.515 0.990 0.475 0.420 4.995 2.410 0.685 0.310 6. One of the options is for Caf Kenya to grow organically adding 5 company owned and 15 franchise locations over a 5 year period. If the new locations had the same sales and cost structure per location as was the case in 2018 a. What would the gross sales be for the combined 48 stores? b. What would the Combined gross profit be for the 12 company owned stores? Exhibit 1 Caf Kenya Simplified Income Statement (in $000s) Sales from company-owned stores Cost of goods sold Gross profit from company-owned stores Store-level wages Store-level promotions and marketing Rent and other fixed expenses Store-level EBITDA 2017 3,200.00 985.00 2,215.00 953.60 58.00 447.00 756.40 2018 3,400.00 1,001.00 2,399.00 986.00 64.00 509.00 840.00 Sales from franchise stores New onetime franchise payments to Caf Kenya Franchise royalty payments to Caf Kenya Franchise advertising % Franchise revenue to Caf Kenya corporate Marketing/promotions allocated to franchise stores Startup costs for new franchise stores Franchise gross margin 8,400.00 60.00 420.00 336.00 816.00 9,030.00 60.00 451.50 361.20 872.70 294.00 60.00 462.00 316.05 60.00 496.65 Corporate-level expenses Expenses for company-owned stores Expenses for franchised stores General corporate overhead Net EBITDA 98.00 66.20 48.50 1,005.70 104.00 70.10 65.00 1,097.55 Exhibit 2 Caf Kenya Locations, January 1, 2019 City Number First Company Opened Owned 2018 Revenue Franchised Nairobi Mombasa Kisumu Nakuru 15 8 3 2 Nw0 GT 2011 2013 2016 2017 3 2 1 1 2018 Revenue Company Owned 1.515 0.990 0.475 0.420 4.995 2.410 0.685 0.310 6. One of the options is for Caf Kenya to grow organically adding 5 company owned and 15 franchise locations over a 5 year period. If the new locations had the same sales and cost structure per location as was the case in 2018 a. What would the gross sales be for the combined 48 stores? b. What would the Combined gross profit be for the 12 company owned stores