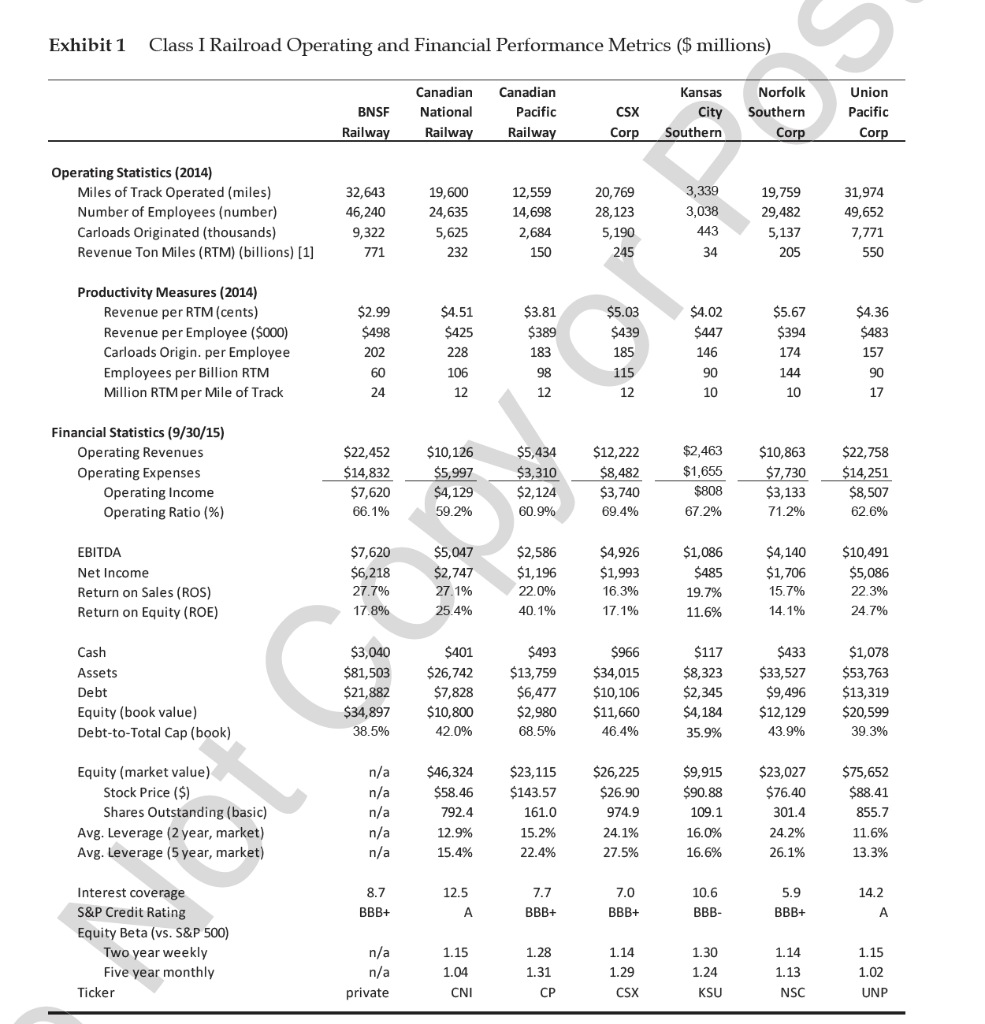
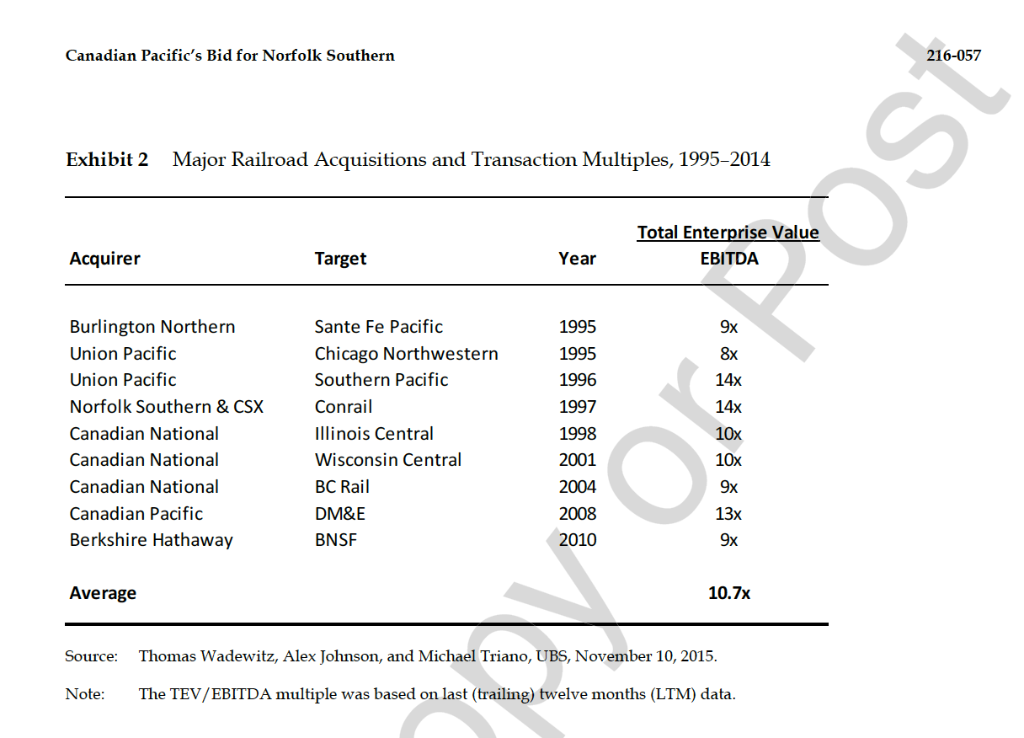
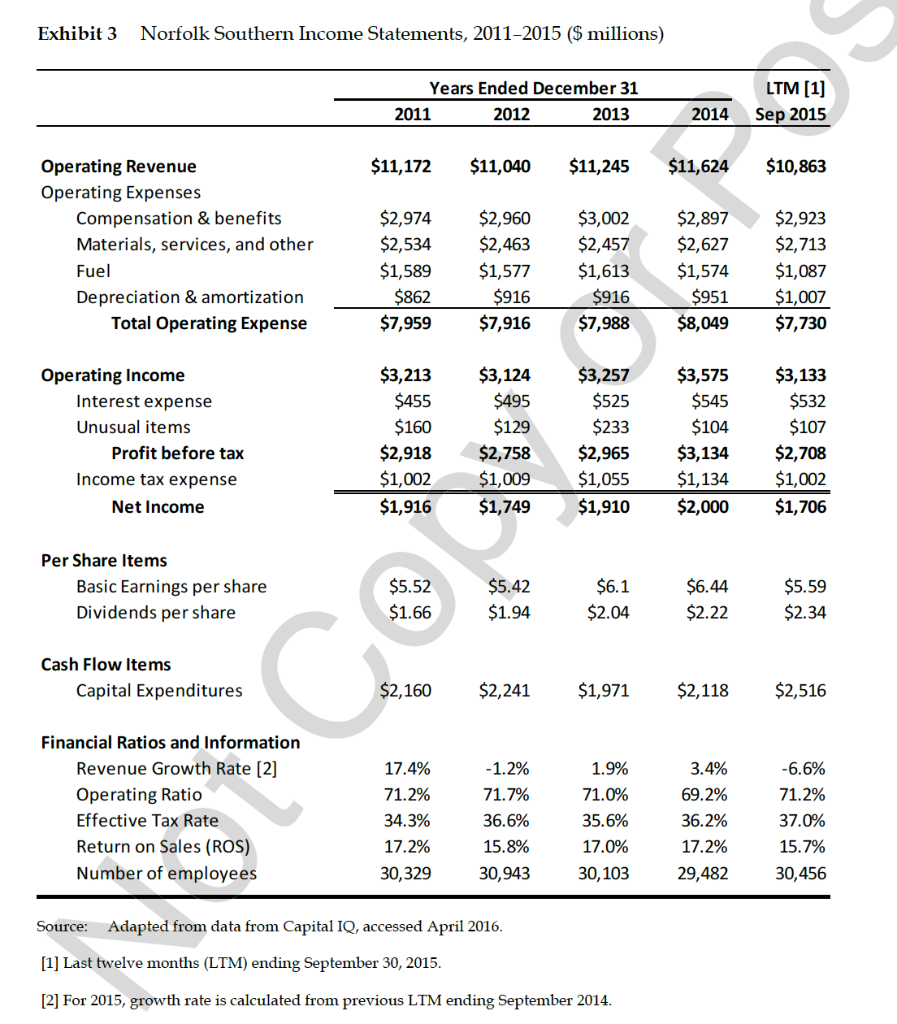
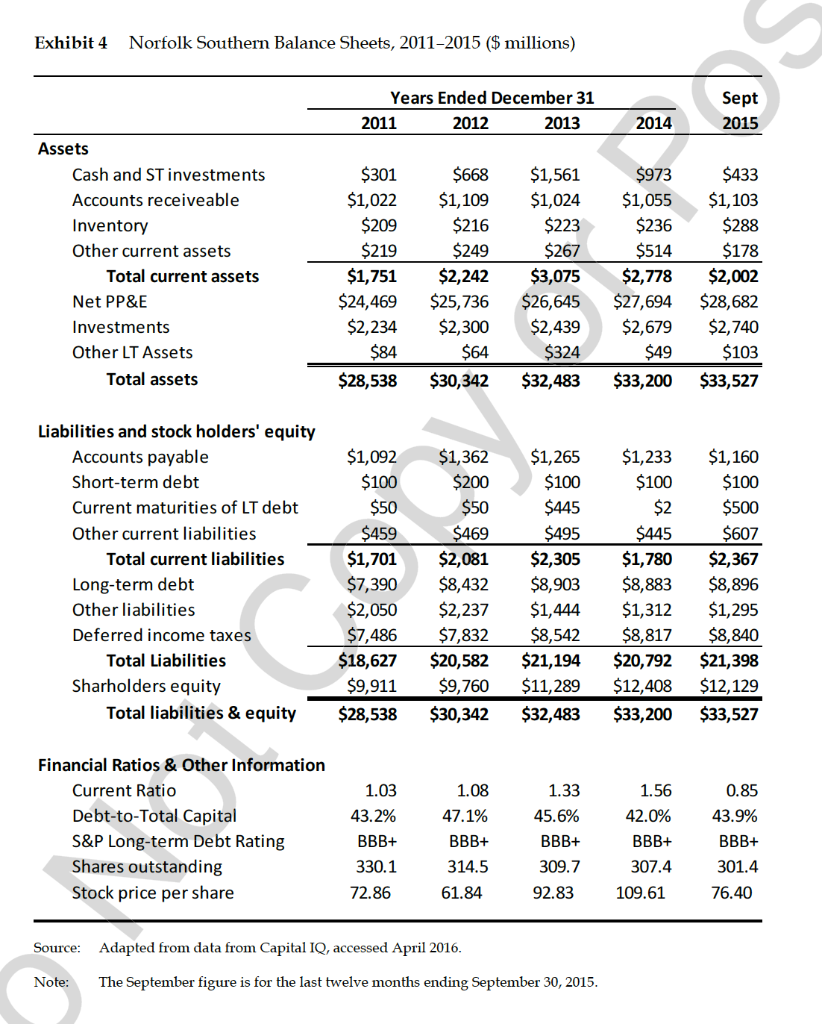


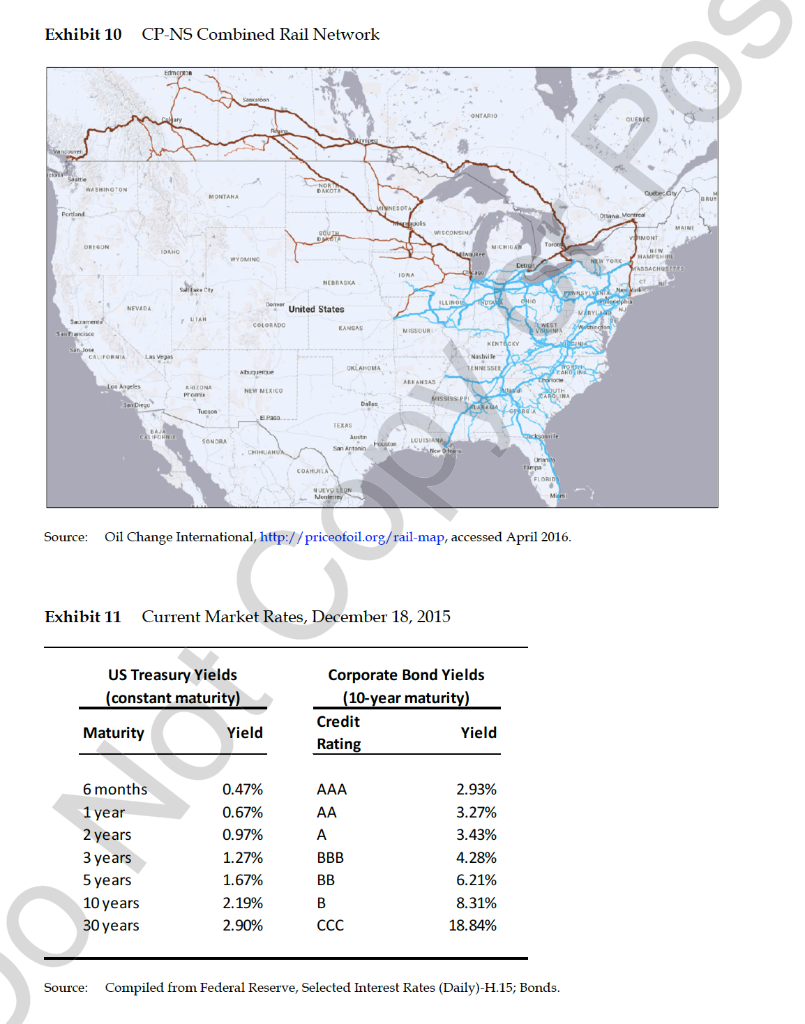
Exhibit 1 Class I Railroad Operating and Financial Performance Metrics ($ millions) BNSF Railway Canadian National Railway Canadian Pacific Railway CSX Corp Kansas City Southern Norfolk Southern Corp Union Pacific Corp Operating Statistics (2014) Miles of Track Operated (miles) Number of Employees (number) Carloads Originated (thousands) Revenue Ton Miles (RTM) (billions) [1] 32,643 46,240 9,322 19,600 24,635 5,625 232 12,559 14,698 2,684 20,769 28,123 5,190 245 3,339 3,038 443 19,759 29,482 5,137 205 31,974 49,652 7,771 550 771 150 $2.99 $498 $4.51 $425 228 $3.81 $389 $5.03 $439 Productivity Measures (2014) Revenue per RTM (cents) Revenue per Employee ($000) Carloads Origin. per Employee Employees per Billion RTM Million RTM per Mile of Track $4.02 $447 146 $4.36 $483 $5.67 $394 174 144 202 185 106 115 10 Financial Statistics (9/30/15) Operating Revenues Operating Expenses Operating Income Operating Ratio (%) $22,452 $14,832 $7,620 66.1% $10,126 $5,997 $4,129 59.2% $5,434 $3,310 $2,124 60.9% $12,222 $8,482 $3,740 69.4% $2,463 $1,655 $808 67.2% $10,863 $7,730 $3,133 71.2% $22,758 $14,251 $8,507 62.6% EBITDA Net Income Return on Sales (ROS) Return on Equity (ROE) $7,620 $6,218 27.7% 17.8% $5,047 $2,747 27.1% 25.4% $2,586 $1,196 22.0% 40.1% $4,926 $1,993 16.3% 17.1% $1,086 $485 19.7% 11.6% $4,140 $1,706 15.7% 14.1% $10,491 $5,086 22.3% 24.7% $433 Cash Assets Debt Equity (book value) Debt-to-Total Cap (book) $3,040 $81,503 $21,882 $34,897 38.5% $401 $26,742 $7,828 $10,800 42.0% $493 $13,759 $6,477 $2,980 68.5% $966 $34,015 $10,106 $11,660 46.4% $117 $8,323 $2,345 $4,184 35.9% $33,527 $9,496 $12,129 43.9% $1,078 $53,763 $13,319 $20,599 39.3% n/a Equity (market value) Stock Price ($) Shares Outstanding (basic) Avg. Leverage (2 year, market) Avg. Leverage (5 year, market) $46,324 $58.46 792.4 12.9% 15.4% $23,115 $143.57 161.0 15.2% 22.4% $26,225 $26.90 974.9 $9,915 $90.88 109.1 16.0% 16.6% $23,027 $76.40 301.4 24.2% 26.1% $75,652 $88.41 855.7 11.6% 13.3% n/a 24.1% 27.5% 8.7 12.5 14.2 7.7 BBB+ 7.0 BBB+ 10.6 BBB- 5.9 BBB+ BBB+ Interest coverage S&P Credit Rating Equity Beta (vs. S&P 500) Two year weekly Five year monthly Ticker n/a n/a private 1.15 1.04 CNI 1.28 1.31 CP 1.14 1.29 CSX 1.30 1.24 KSU 1.14 1.13 NSC 1.15 1.02 UNP Canadian Pacific's Bid for Norfolk Southern 216-057 Exhibit 2 Major Railroad Acquisitions and Transaction Multiples, 1995-2014 Total Enterprise Value EBITDA Acquirer Target Year Burlington Northern Union Pacific Union Pacific Norfolk Southern & CSX Canadian National Canadian National Canadian National Canadian Pacific Berkshire Hathaway Sante Fe Pacific Chicago Northwestern Southern Pacific Conrail Illinois Central Wisconsin Central BC Rail DM&E BNSF 1995 1995 1996 1997 1998 2001 2004 2008 2010 Average 10.7x Source: Thomas Wadewitz, Alex Johnson, and Michael Triano, UBS, November 10, 2015. Note: The TEV/EBITDA multiple was based on last (trailing) twelve months (LTM) data. Exhibit 3 Norfolk Southern Income Statements, 2011-2015 ($ millions) Years Ended December 31 2011 2012 2013 LTM (1) Sep 2015 2014 $11,172 $11,040 $11,245 $11,624 $10,863 Operating Revenue Operating Expenses Compensation & benefits Materials, services, and other Fuel Depreciation & amortization Total Operating Expense $2,974 $2,534 $1,589 $862 $7,959 $2,960 $2,463 $1,577 $916 $7,916 $3,002 $2,457 $1,613 $916 $7,988 $2,897 $2,627 $1,574 $951 $8,049 $2,923 $2,713 $1,087 $1,007 $7,730 $3,575 $3,133 $532 $107 Operating Income Interest expense Unusual items Profit before tax Income tax expense Net Income $3,213 $455 $160 $2,918 $1,002 $1,916 $3,124 $495 $129 $2,758 $1,009 $1,749 $3,257 $525 $233 $2,965 $1,055 $1,910 $545 $104 $3,134 $1,134 $2,000 $2,708 $1,002 $1,706 Per Share Items Basic Earnings per share Dividends per share $5.52 $1.66 $5.42 $1.94 $6.1 $2.04 $6.44 $2.22 $5.59 $2.34 Cash Flow Items Capital Expenditures $2,160 $2,241 $1,971 $2,118 $2,516 Financial Ratios and Information Revenue Growth Rate (2] Operating Ratio Effective Tax Rate Return on Sales (ROS) Number of employees 17.4% 71.2% 34.3% 17.2% 30,329 -1.2% 71.7% 36.6% 15.8% 30,943 1.9% 71.0% 35.6% 17.0% 30,103 3.4% 69.2% 36.2% 17.2% 29,482 -6.6% 71.2% 37.0% 15.7% 30,456 Source: Adapted from data from Capital IQ, accessed April 2016. [1] Last twelve months (LTM) ending September 30, 2015. [2] For 2015, growth rate is calculated from previous LTM ending September 2014. Exhibit 4 Norfolk Southern Balance Sheets, 2011-2015 ($ millions) Years Ended December 31 2011 2012 2013 2014 Sept 2015 6 Assets Cash and ST investments Accounts receiveable Inventory Other current assets Total current assets Net PP&E Investments Other LT Assets Total assets $301 $1,022 $209 $219 $1,751 $24,469 $2,234 $84 $28,538 $668 $1,109 $216 $249 $2,242 $25,736 $2,300 $64 $30,342 $1,561 $1,024 $223 $267 $3,075 $26,645 $2,439 $324 $32,483 $973 $1,055 $236 $514 $2,778 $27,694 $2,679 $49 $33,200 $433 $1,103 $288 $178 $2,002 $28,682 $2,740 $103 $33,527 Liabilities and stock holders' equity Accounts payable Short-term debt Current maturities of LT debt Other current liabilities Total current liabilities Long-term debt Other liabilities Deferred income taxes Total Liabilities Sharholders equity Total liabilities & equity $1,092 $100 $50 $459 $1,701 $7,390 $2,050 $7,486 $18,627 $9,911 $28,538 $1,362 $200 $50 $469 $2,081 $8,432 $2,237 $7,832 $20,582 $9,760 $30,342 $1,265 $100 $445 $495 $2,305 $8,903 $1,444 $8,542 $21,194 $11,289 $32,483 $1,233 $100 $2 $445 $1,780 $8,883 $1,312 $8,817 $20,792 $12,408 $33,200 $1,160 $100 $500 $607 $2,367 $8,896 $1,295 $8,840 $21,398 $12, 129 $33,527 Financial Ratios & Other Information Current Ratio Debt-to-Total Capital S&P Long-term Debt Rating Shares outstanding Stock price per share 1.03 43.2% BBB+ 330.1 72.86 1.08 1.33 47.1% 45.6% BBB+ BBB+ 314.5 309.7 61.84 92.83 1.56 0.85 42.0% 43.9% BBB+ BBB+ 307.4 301.4 109.6176.40 Source: Adapted from data from Capital IQ, accessed April 2016. Note: The September figure is for the last twelve months ending September 30, 2015. Exhibit 5 Operating Ratios for Class I Railroads, 2006-2015 85% 80% DOS 75% 70% 65% 60% 55% + 2006 CSX 2007 2008 2009 2010 2011 2012 2013 2014 2015est NS .... CNI --BNSF .... UNP --KCS CP Source: Canadian Pacific Presentation, "CP's Value Proposition," December 8, 2015, p. 6; Capital IQ, accessed April 2016; and casewriter estimates. Exhibit 6 Norfolk Southern Projections on a Stand-alone Basis, October 2015 ($ millions) Est. 2015 2016 Projected (period ending 12/31) Proiected 2017 2018 2019 2020 2021 Income statement items Revenue Growth rate (%) $10,649 $11,175 4.5% $6,570 Operating expenses Depreciation (1) EBIT $10,698 0.5% $6,397 $1,091 $3,210 $6,548 $1,049 $3,052 $11,671 4.4% $6,808 $1,180 $3,683 68% $12,191 4.5% $7,049 $1,227 $3,915 $12,557 3.0% $7,139 $1,300 $4,118 $12,871 2.5% $7,440 $1,313 $4,118 $3,470 Operating ratio 71% 70% 69% 68% 67% 68% Balance sheet items Capital expenditures Net working capital [2] $2,365 ($192) $2,070 ($128) $1,910 ($134) $1,930 ($140) $1,930 ($146) $1,949 ($151) $1,969 ($154) Source: Compiled from UBS Global Research, Norfolk Southern Corporation, October 28, 2015; and casewriter estimates. [1] Because the expected useful life of a railroad's fixed assets was very long (up to 40 years) and depreciation was based on historical cost, the ratio of Cap Ex to Depreciation was typically greater than one. Historically, the average ratio of Cap Ex to Depreciation for Norfolk Southern was about 1.5. The historical ratio of Cap Ex to Depreciation of 1.5 was expected to hold during the period after 2021. [2] The level of net working capital equals the sum of accounts receivable, inventory, and other current assets minus the sum of accounts payable and other current liabilities. Exhibit 7 Canadian Pacific Railway Income Statements, 2011-2015 ($ millions) Years Ended December 31 2011 2012 2013 LTM (1) Sep 2015 2014 $5,092 $5,714 $5,773 $5,716 $5,434 Operating Revenue Operating Expenses Compensation & benefits Materials, services, and other Fuel Depreciation & amortization Total Operating Expense $1,403 $1,304 $952 $482 $4,141 $1,479 $1,421 $1,002 $1,297 $1,253 $945 $532 $4,027 $1,164 $1,151 $905 $477 $3,697 $1,079 $1,125 $643 $463 $541 $45 $4,443 $3,310 Operating Income Interest expense Unusual items Profit before tax Income tax expense Net Income $951 $248 ($18) $686 $125 $561 $1,271 $277 ($356) $638 $153 $485 $1,746 $262 $426) $1,059 $235 $824 $2,020 $244 ($16) $1,760 $485 $1,274 $2,124 $274 ($141) $1,708 $512 $1,196 Per Share Items Basic Earnings per share Dividends per share $3.31 $1.15 $2.83 $1.35 $4.71 $1.32 $7.37 $121 $7.27 $1.12 Cash Flow Items Capital Expenditures $1,086 $1,152 $1,163 $1,251 $1,210 Financial Ratios and Information Revenue Growth Rate (2] Operating Ratio Effective Tax Rate Return on Sales (ROS) Number of employees 1.7% 81.3% 18.2% 11.0% 14,169 12.2% 77.8% 23.9% 8.5% 14,594 1.0% 69.8% 22.2% 14.3% 14,977 -1.0% 64.7% 27.6% 22.3% 14,698 -8.7% 60.9% 30.0% 22.0% 14,698 Source: Adapted from data from Capital IQ, accessed April 2016. [1] Last twelve months (LTM) ending September 30, 2015. [2] For 2015, growth rate is calculated from previous LTM ending September 2014. Exhibit 7 Canadian Pacific Railway Income Statements, 2011-2015 ($ millions) Years Ended December 31 2011 2012 2013 LTM (1) Sep 2015 2014 $5,092 $5,714 $5,773 $5,716 $5,434 Operating Revenue Operating Expenses Compensation & benefits Materials, services, and other Fuel Depreciation & amortization Total Operating Expense $1,403 $1,304 $952 $482 $4,141 $1,479 $1,421 $1,002 $1,297 $1,253 $945 $532 $4,027 $1,164 $1,151 $905 $477 $3,697 $1,079 $1,125 $643 $463 $541 $45 $4,443 $3,310 Operating Income Interest expense Unusual items Profit before tax Income tax expense Net Income $951 $248 ($18) $686 $125 $561 $1,271 $277 ($356) $638 $153 $485 $1,746 $262 $426) $1,059 $235 $824 $2,020 $244 ($16) $1,760 $485 $1,274 $2,124 $274 ($141) $1,708 $512 $1,196 Per Share Items Basic Earnings per share Dividends per share $3.31 $1.15 $2.83 $1.35 $4.71 $1.32 $7.37 $121 $7.27 $1.12 Cash Flow Items Capital Expenditures $1,086 $1,152 $1,163 $1,251 $1,210 Financial Ratios and Information Revenue Growth Rate (2] Operating Ratio Effective Tax Rate Return on Sales (ROS) Number of employees 1.7% 81.3% 18.2% 11.0% 14,169 12.2% 77.8% 23.9% 8.5% 14,594 1.0% 69.8% 22.2% 14.3% 14,977 -1.0% 64.7% 27.6% 22.3% 14,698 -8.7% 60.9% 30.0% 22.0% 14,698 Source: Adapted from data from Capital IQ, accessed April 2016. [1] Last twelve months (LTM) ending September 30, 2015. [2] For 2015, growth rate is calculated from previous LTM ending September 2014. Exhibit 9a Stock Prices for Norfolk Southern and Canadian Pacific (in U.S. dollars) Stock Price $100 NSC --- CP (Indexed to NSC on 10/1/15) Market (Indexed to NSC on 10/1/15) $60 10/1 10/8 10/15 10/22 10/29 11/5 11/12 11/19 11/26 12/3 12/10 12/17 Source: Casewriter analysis using data from the Center for Research in Security Prices, accessed April 2016. Exhibit 9b Selected Stock Prices for Norfolk Southern and Canadian Pacific (in U.S. dollars) Period Beg End Timeline Event NS Stock Price Beg End Change CP Stock Price Beg End Change Merger Rumors Initial CP Offer 10/01/15 - 11/06/15 11/06/15 - 11/09/15 11/09/15 - 11/17/15 11/17/15 - 11/18/15 11/18/15 - 12/03/15 12/03/15 - 12/04/15 12/04/15 - 12/07/15 12/07/15 - 12/08/15 12/08/15 - 12/18/15 $77.33 $79.87 79.87 88.62 88.62 86.97 86.97 92.49 92.4993.11 93.11 92.06 92.06 91.52 91.52 86.32 86.32 84.27 $2.54 8 .75 (1.65) 5 .52 0.62 (1.05) (0.54) (5.20) (2.05) $146.36 134.31 142.18 138.58 146.65 140.91 134.49 130.48 126.13 $134.31 142.18 138.58 146.65 140.91 134.49 130.48 126.13 125.07 $12.05) 7.87 (3.60) 8.07 (5.74) (6.42) (4.01) (4.35) (1.06) NS Rejects Offer Revised CP Offer Source: Casewriter analysis using data from the Center for Research in Security Prices, accessed April 2016. Exhibit 10 CP-NS Combined Rail Network NONT ADM CHI HORA ELLINO Serra United States COLORADO maandag KENTOCICY bendroite Austin Source: Oil Change International, http://priceofoil.org/rail-map, accessed April 2016. Exhibit 11 Current Market Rates, December 18, 2015 US Treasury Yields (constant maturity) Corporate Bond Yields (10-year maturity) Credit Yield Rating Maturity Yield 6 months 1 year 2 years 3 years 5 years 10 years 30 years 0.47% 0.67% 0.97% 1.27% 1.67% 2.19% 2.90% A BBB CCC 2.93% 3.27% 3.43% 4.28% 6.21% 8.31% 18.84% Source: Compiled from Federal Reserve, Selected Interest Rates (Daily)-H.15; Bonds. 1. Short synopsis of the facts of the case. 2. Description of the financial position and issues at play. 3. Explanation of decisions used in the financial analysis 4. Presentation of financial solutions and analysis 5. Presentation of recommendations. 6. Overall clarity and coherence of writing, grammar, spelling, punctuation, acrony first use, avoidance of contractions. Exhibit 1 Class I Railroad Operating and Financial Performance Metrics ($ millions) BNSF Railway Canadian National Railway Canadian Pacific Railway CSX Corp Kansas City Southern Norfolk Southern Corp Union Pacific Corp Operating Statistics (2014) Miles of Track Operated (miles) Number of Employees (number) Carloads Originated (thousands) Revenue Ton Miles (RTM) (billions) [1] 32,643 46,240 9,322 19,600 24,635 5,625 232 12,559 14,698 2,684 20,769 28,123 5,190 245 3,339 3,038 443 19,759 29,482 5,137 205 31,974 49,652 7,771 550 771 150 $2.99 $498 $4.51 $425 228 $3.81 $389 $5.03 $439 Productivity Measures (2014) Revenue per RTM (cents) Revenue per Employee ($000) Carloads Origin. per Employee Employees per Billion RTM Million RTM per Mile of Track $4.02 $447 146 $4.36 $483 $5.67 $394 174 144 202 185 106 115 10 Financial Statistics (9/30/15) Operating Revenues Operating Expenses Operating Income Operating Ratio (%) $22,452 $14,832 $7,620 66.1% $10,126 $5,997 $4,129 59.2% $5,434 $3,310 $2,124 60.9% $12,222 $8,482 $3,740 69.4% $2,463 $1,655 $808 67.2% $10,863 $7,730 $3,133 71.2% $22,758 $14,251 $8,507 62.6% EBITDA Net Income Return on Sales (ROS) Return on Equity (ROE) $7,620 $6,218 27.7% 17.8% $5,047 $2,747 27.1% 25.4% $2,586 $1,196 22.0% 40.1% $4,926 $1,993 16.3% 17.1% $1,086 $485 19.7% 11.6% $4,140 $1,706 15.7% 14.1% $10,491 $5,086 22.3% 24.7% $433 Cash Assets Debt Equity (book value) Debt-to-Total Cap (book) $3,040 $81,503 $21,882 $34,897 38.5% $401 $26,742 $7,828 $10,800 42.0% $493 $13,759 $6,477 $2,980 68.5% $966 $34,015 $10,106 $11,660 46.4% $117 $8,323 $2,345 $4,184 35.9% $33,527 $9,496 $12,129 43.9% $1,078 $53,763 $13,319 $20,599 39.3% n/a Equity (market value) Stock Price ($) Shares Outstanding (basic) Avg. Leverage (2 year, market) Avg. Leverage (5 year, market) $46,324 $58.46 792.4 12.9% 15.4% $23,115 $143.57 161.0 15.2% 22.4% $26,225 $26.90 974.9 $9,915 $90.88 109.1 16.0% 16.6% $23,027 $76.40 301.4 24.2% 26.1% $75,652 $88.41 855.7 11.6% 13.3% n/a 24.1% 27.5% 8.7 12.5 14.2 7.7 BBB+ 7.0 BBB+ 10.6 BBB- 5.9 BBB+ BBB+ Interest coverage S&P Credit Rating Equity Beta (vs. S&P 500) Two year weekly Five year monthly Ticker n/a n/a private 1.15 1.04 CNI 1.28 1.31 CP 1.14 1.29 CSX 1.30 1.24 KSU 1.14 1.13 NSC 1.15 1.02 UNP Canadian Pacific's Bid for Norfolk Southern 216-057 Exhibit 2 Major Railroad Acquisitions and Transaction Multiples, 1995-2014 Total Enterprise Value EBITDA Acquirer Target Year Burlington Northern Union Pacific Union Pacific Norfolk Southern & CSX Canadian National Canadian National Canadian National Canadian Pacific Berkshire Hathaway Sante Fe Pacific Chicago Northwestern Southern Pacific Conrail Illinois Central Wisconsin Central BC Rail DM&E BNSF 1995 1995 1996 1997 1998 2001 2004 2008 2010 Average 10.7x Source: Thomas Wadewitz, Alex Johnson, and Michael Triano, UBS, November 10, 2015. Note: The TEV/EBITDA multiple was based on last (trailing) twelve months (LTM) data. Exhibit 3 Norfolk Southern Income Statements, 2011-2015 ($ millions) Years Ended December 31 2011 2012 2013 LTM (1) Sep 2015 2014 $11,172 $11,040 $11,245 $11,624 $10,863 Operating Revenue Operating Expenses Compensation & benefits Materials, services, and other Fuel Depreciation & amortization Total Operating Expense $2,974 $2,534 $1,589 $862 $7,959 $2,960 $2,463 $1,577 $916 $7,916 $3,002 $2,457 $1,613 $916 $7,988 $2,897 $2,627 $1,574 $951 $8,049 $2,923 $2,713 $1,087 $1,007 $7,730 $3,575 $3,133 $532 $107 Operating Income Interest expense Unusual items Profit before tax Income tax expense Net Income $3,213 $455 $160 $2,918 $1,002 $1,916 $3,124 $495 $129 $2,758 $1,009 $1,749 $3,257 $525 $233 $2,965 $1,055 $1,910 $545 $104 $3,134 $1,134 $2,000 $2,708 $1,002 $1,706 Per Share Items Basic Earnings per share Dividends per share $5.52 $1.66 $5.42 $1.94 $6.1 $2.04 $6.44 $2.22 $5.59 $2.34 Cash Flow Items Capital Expenditures $2,160 $2,241 $1,971 $2,118 $2,516 Financial Ratios and Information Revenue Growth Rate (2] Operating Ratio Effective Tax Rate Return on Sales (ROS) Number of employees 17.4% 71.2% 34.3% 17.2% 30,329 -1.2% 71.7% 36.6% 15.8% 30,943 1.9% 71.0% 35.6% 17.0% 30,103 3.4% 69.2% 36.2% 17.2% 29,482 -6.6% 71.2% 37.0% 15.7% 30,456 Source: Adapted from data from Capital IQ, accessed April 2016. [1] Last twelve months (LTM) ending September 30, 2015. [2] For 2015, growth rate is calculated from previous LTM ending September 2014. Exhibit 4 Norfolk Southern Balance Sheets, 2011-2015 ($ millions) Years Ended December 31 2011 2012 2013 2014 Sept 2015 6 Assets Cash and ST investments Accounts receiveable Inventory Other current assets Total current assets Net PP&E Investments Other LT Assets Total assets $301 $1,022 $209 $219 $1,751 $24,469 $2,234 $84 $28,538 $668 $1,109 $216 $249 $2,242 $25,736 $2,300 $64 $30,342 $1,561 $1,024 $223 $267 $3,075 $26,645 $2,439 $324 $32,483 $973 $1,055 $236 $514 $2,778 $27,694 $2,679 $49 $33,200 $433 $1,103 $288 $178 $2,002 $28,682 $2,740 $103 $33,527 Liabilities and stock holders' equity Accounts payable Short-term debt Current maturities of LT debt Other current liabilities Total current liabilities Long-term debt Other liabilities Deferred income taxes Total Liabilities Sharholders equity Total liabilities & equity $1,092 $100 $50 $459 $1,701 $7,390 $2,050 $7,486 $18,627 $9,911 $28,538 $1,362 $200 $50 $469 $2,081 $8,432 $2,237 $7,832 $20,582 $9,760 $30,342 $1,265 $100 $445 $495 $2,305 $8,903 $1,444 $8,542 $21,194 $11,289 $32,483 $1,233 $100 $2 $445 $1,780 $8,883 $1,312 $8,817 $20,792 $12,408 $33,200 $1,160 $100 $500 $607 $2,367 $8,896 $1,295 $8,840 $21,398 $12, 129 $33,527 Financial Ratios & Other Information Current Ratio Debt-to-Total Capital S&P Long-term Debt Rating Shares outstanding Stock price per share 1.03 43.2% BBB+ 330.1 72.86 1.08 1.33 47.1% 45.6% BBB+ BBB+ 314.5 309.7 61.84 92.83 1.56 0.85 42.0% 43.9% BBB+ BBB+ 307.4 301.4 109.6176.40 Source: Adapted from data from Capital IQ, accessed April 2016. Note: The September figure is for the last twelve months ending September 30, 2015. Exhibit 5 Operating Ratios for Class I Railroads, 2006-2015 85% 80% DOS 75% 70% 65% 60% 55% + 2006 CSX 2007 2008 2009 2010 2011 2012 2013 2014 2015est NS .... CNI --BNSF .... UNP --KCS CP Source: Canadian Pacific Presentation, "CP's Value Proposition," December 8, 2015, p. 6; Capital IQ, accessed April 2016; and casewriter estimates. Exhibit 6 Norfolk Southern Projections on a Stand-alone Basis, October 2015 ($ millions) Est. 2015 2016 Projected (period ending 12/31) Proiected 2017 2018 2019 2020 2021 Income statement items Revenue Growth rate (%) $10,649 $11,175 4.5% $6,570 Operating expenses Depreciation (1) EBIT $10,698 0.5% $6,397 $1,091 $3,210 $6,548 $1,049 $3,052 $11,671 4.4% $6,808 $1,180 $3,683 68% $12,191 4.5% $7,049 $1,227 $3,915 $12,557 3.0% $7,139 $1,300 $4,118 $12,871 2.5% $7,440 $1,313 $4,118 $3,470 Operating ratio 71% 70% 69% 68% 67% 68% Balance sheet items Capital expenditures Net working capital [2] $2,365 ($192) $2,070 ($128) $1,910 ($134) $1,930 ($140) $1,930 ($146) $1,949 ($151) $1,969 ($154) Source: Compiled from UBS Global Research, Norfolk Southern Corporation, October 28, 2015; and casewriter estimates. [1] Because the expected useful life of a railroad's fixed assets was very long (up to 40 years) and depreciation was based on historical cost, the ratio of Cap Ex to Depreciation was typically greater than one. Historically, the average ratio of Cap Ex to Depreciation for Norfolk Southern was about 1.5. The historical ratio of Cap Ex to Depreciation of 1.5 was expected to hold during the period after 2021. [2] The level of net working capital equals the sum of accounts receivable, inventory, and other current assets minus the sum of accounts payable and other current liabilities. Exhibit 7 Canadian Pacific Railway Income Statements, 2011-2015 ($ millions) Years Ended December 31 2011 2012 2013 LTM (1) Sep 2015 2014 $5,092 $5,714 $5,773 $5,716 $5,434 Operating Revenue Operating Expenses Compensation & benefits Materials, services, and other Fuel Depreciation & amortization Total Operating Expense $1,403 $1,304 $952 $482 $4,141 $1,479 $1,421 $1,002 $1,297 $1,253 $945 $532 $4,027 $1,164 $1,151 $905 $477 $3,697 $1,079 $1,125 $643 $463 $541 $45 $4,443 $3,310 Operating Income Interest expense Unusual items Profit before tax Income tax expense Net Income $951 $248 ($18) $686 $125 $561 $1,271 $277 ($356) $638 $153 $485 $1,746 $262 $426) $1,059 $235 $824 $2,020 $244 ($16) $1,760 $485 $1,274 $2,124 $274 ($141) $1,708 $512 $1,196 Per Share Items Basic Earnings per share Dividends per share $3.31 $1.15 $2.83 $1.35 $4.71 $1.32 $7.37 $121 $7.27 $1.12 Cash Flow Items Capital Expenditures $1,086 $1,152 $1,163 $1,251 $1,210 Financial Ratios and Information Revenue Growth Rate (2] Operating Ratio Effective Tax Rate Return on Sales (ROS) Number of employees 1.7% 81.3% 18.2% 11.0% 14,169 12.2% 77.8% 23.9% 8.5% 14,594 1.0% 69.8% 22.2% 14.3% 14,977 -1.0% 64.7% 27.6% 22.3% 14,698 -8.7% 60.9% 30.0% 22.0% 14,698 Source: Adapted from data from Capital IQ, accessed April 2016. [1] Last twelve months (LTM) ending September 30, 2015. [2] For 2015, growth rate is calculated from previous LTM ending September 2014. Exhibit 7 Canadian Pacific Railway Income Statements, 2011-2015 ($ millions) Years Ended December 31 2011 2012 2013 LTM (1) Sep 2015 2014 $5,092 $5,714 $5,773 $5,716 $5,434 Operating Revenue Operating Expenses Compensation & benefits Materials, services, and other Fuel Depreciation & amortization Total Operating Expense $1,403 $1,304 $952 $482 $4,141 $1,479 $1,421 $1,002 $1,297 $1,253 $945 $532 $4,027 $1,164 $1,151 $905 $477 $3,697 $1,079 $1,125 $643 $463 $541 $45 $4,443 $3,310 Operating Income Interest expense Unusual items Profit before tax Income tax expense Net Income $951 $248 ($18) $686 $125 $561 $1,271 $277 ($356) $638 $153 $485 $1,746 $262 $426) $1,059 $235 $824 $2,020 $244 ($16) $1,760 $485 $1,274 $2,124 $274 ($141) $1,708 $512 $1,196 Per Share Items Basic Earnings per share Dividends per share $3.31 $1.15 $2.83 $1.35 $4.71 $1.32 $7.37 $121 $7.27 $1.12 Cash Flow Items Capital Expenditures $1,086 $1,152 $1,163 $1,251 $1,210 Financial Ratios and Information Revenue Growth Rate (2] Operating Ratio Effective Tax Rate Return on Sales (ROS) Number of employees 1.7% 81.3% 18.2% 11.0% 14,169 12.2% 77.8% 23.9% 8.5% 14,594 1.0% 69.8% 22.2% 14.3% 14,977 -1.0% 64.7% 27.6% 22.3% 14,698 -8.7% 60.9% 30.0% 22.0% 14,698 Source: Adapted from data from Capital IQ, accessed April 2016. [1] Last twelve months (LTM) ending September 30, 2015. [2] For 2015, growth rate is calculated from previous LTM ending September 2014. Exhibit 9a Stock Prices for Norfolk Southern and Canadian Pacific (in U.S. dollars) Stock Price $100 NSC --- CP (Indexed to NSC on 10/1/15) Market (Indexed to NSC on 10/1/15) $60 10/1 10/8 10/15 10/22 10/29 11/5 11/12 11/19 11/26 12/3 12/10 12/17 Source: Casewriter analysis using data from the Center for Research in Security Prices, accessed April 2016. Exhibit 9b Selected Stock Prices for Norfolk Southern and Canadian Pacific (in U.S. dollars) Period Beg End Timeline Event NS Stock Price Beg End Change CP Stock Price Beg End Change Merger Rumors Initial CP Offer 10/01/15 - 11/06/15 11/06/15 - 11/09/15 11/09/15 - 11/17/15 11/17/15 - 11/18/15 11/18/15 - 12/03/15 12/03/15 - 12/04/15 12/04/15 - 12/07/15 12/07/15 - 12/08/15 12/08/15 - 12/18/15 $77.33 $79.87 79.87 88.62 88.62 86.97 86.97 92.49 92.4993.11 93.11 92.06 92.06 91.52 91.52 86.32 86.32 84.27 $2.54 8 .75 (1.65) 5 .52 0.62 (1.05) (0.54) (5.20) (2.05) $146.36 134.31 142.18 138.58 146.65 140.91 134.49 130.48 126.13 $134.31 142.18 138.58 146.65 140.91 134.49 130.48 126.13 125.07 $12.05) 7.87 (3.60) 8.07 (5.74) (6.42) (4.01) (4.35) (1.06) NS Rejects Offer Revised CP Offer Source: Casewriter analysis using data from the Center for Research in Security Prices, accessed April 2016. Exhibit 10 CP-NS Combined Rail Network NONT ADM CHI HORA ELLINO Serra United States COLORADO maandag KENTOCICY bendroite Austin Source: Oil Change International, http://priceofoil.org/rail-map, accessed April 2016. Exhibit 11 Current Market Rates, December 18, 2015 US Treasury Yields (constant maturity) Corporate Bond Yields (10-year maturity) Credit Yield Rating Maturity Yield 6 months 1 year 2 years 3 years 5 years 10 years 30 years 0.47% 0.67% 0.97% 1.27% 1.67% 2.19% 2.90% A BBB CCC 2.93% 3.27% 3.43% 4.28% 6.21% 8.31% 18.84% Source: Compiled from Federal Reserve, Selected Interest Rates (Daily)-H.15; Bonds. 1. Short synopsis of the facts of the case. 2. Description of the financial position and issues at play. 3. Explanation of decisions used in the financial analysis 4. Presentation of financial solutions and analysis 5. Presentation of recommendations. 6. Overall clarity and coherence of writing, grammar, spelling, punctuation, acrony first use, avoidance of contractions