Answered step by step
Verified Expert Solution
Question
1 Approved Answer
Exhibit 1 Condensed Operating and Stockholder Information, Robertson Tool Company (millions of dollars except per-share data) 1998 1999 2000 2001 2002 Operations Sales $ 48.5
| Exhibit 1 Condensed Operating and Stockholder Information, Robertson Tool Company (millions of dollars except per-share data) | |||||
| 1998 | 1999 | 2000 | 2001 | 2002 | |
| Operations | |||||
| Sales | $ 48.5 | $ 49.1 | $ 53.7 | $ 54.8 | $ 55.3 |
| Cost of Goods | 32.6 | 33.1 | 35.9 | 37.2 | 37.9 |
| Selling, General and | |||||
| Administrative Costs | 10.7 | 11.1 | 11.5 | 11.9 | 12.3 |
| Depreciation Expense | 2.0 | 2.3 | 2.4 | 2.3 | 2.1 |
| Interest Expense | .4 | .7 | .8 | .8 | .8 |
| Income Before Taxes | 2.8 | 1.9 | 3.1 | 2.6 | 2.2 |
| Taxes | 1.1 | .8 | 1.2 | 1.0 | .9 |
| Net Income | $1.7 | $1.1 | $1.9 | $1.6 | $1.3 |
| Percentage of Sales | |||||
| Cost of Goods | 67% | 67% | 67% | 68% | 69% |
| Sell, Gen'l, Admin. | 22% | 23% | 21% | 22% | 22% |
| Operating Income | 6.6% | 5.3% | 7.3% | 6.2% | 5.4% |
| Stockholder Information | |||||
| Earnings Per Share | $ 2.91 | $ 1.88 | $ 3.25 | $ 2.74 | $ 2.23 |
| Dividends Per Share | 1.60 | 1.60 | 1.60 | 1.60 | 1.60 |
| Book Value Per Share | 49.40 | 49.68 | 51.33 | 52.47 | 53.10 |
| Market Price | 33-46 | 35-48 | 29-41 | 25-33 | 23-32 |
| Price/Earnings Ratio | 11-16 | 10-26 | 9-13 | 9-12 | 10-14 |
| Shares Outstanding | 584,000 | 584,000 | 584,000 | 584,000 | 584,000 |
| Exhibit 2 Balance Sheet at December 31, 2002, Robertson Tool Company (millions of dollars) | ||||
| Assets | Liabilities and Net Worth | |||
| Cash | $ 1 | Accounts Payable | $ 2 | |
| Accounts Receivable | 8 | Other | 2 | |
| Inventories | 18 | Current Liabilities | 4 | |
| Other | 1 | Long-term Debt | 12 | |
| Current Assets | 28 | |||
| Net Plant and Equipment | 19 | Net Worth | 31 | |
| Total Assets | $ 47 | Total | $ 47 | |
| Collection Period (days) | 53 | Debt as % Capital | 28% | |
| Days of Inventory (days) | 173 | Total Assets/Net Worth | 1.52 | |
| Sales/Total Assets | 1.18 |
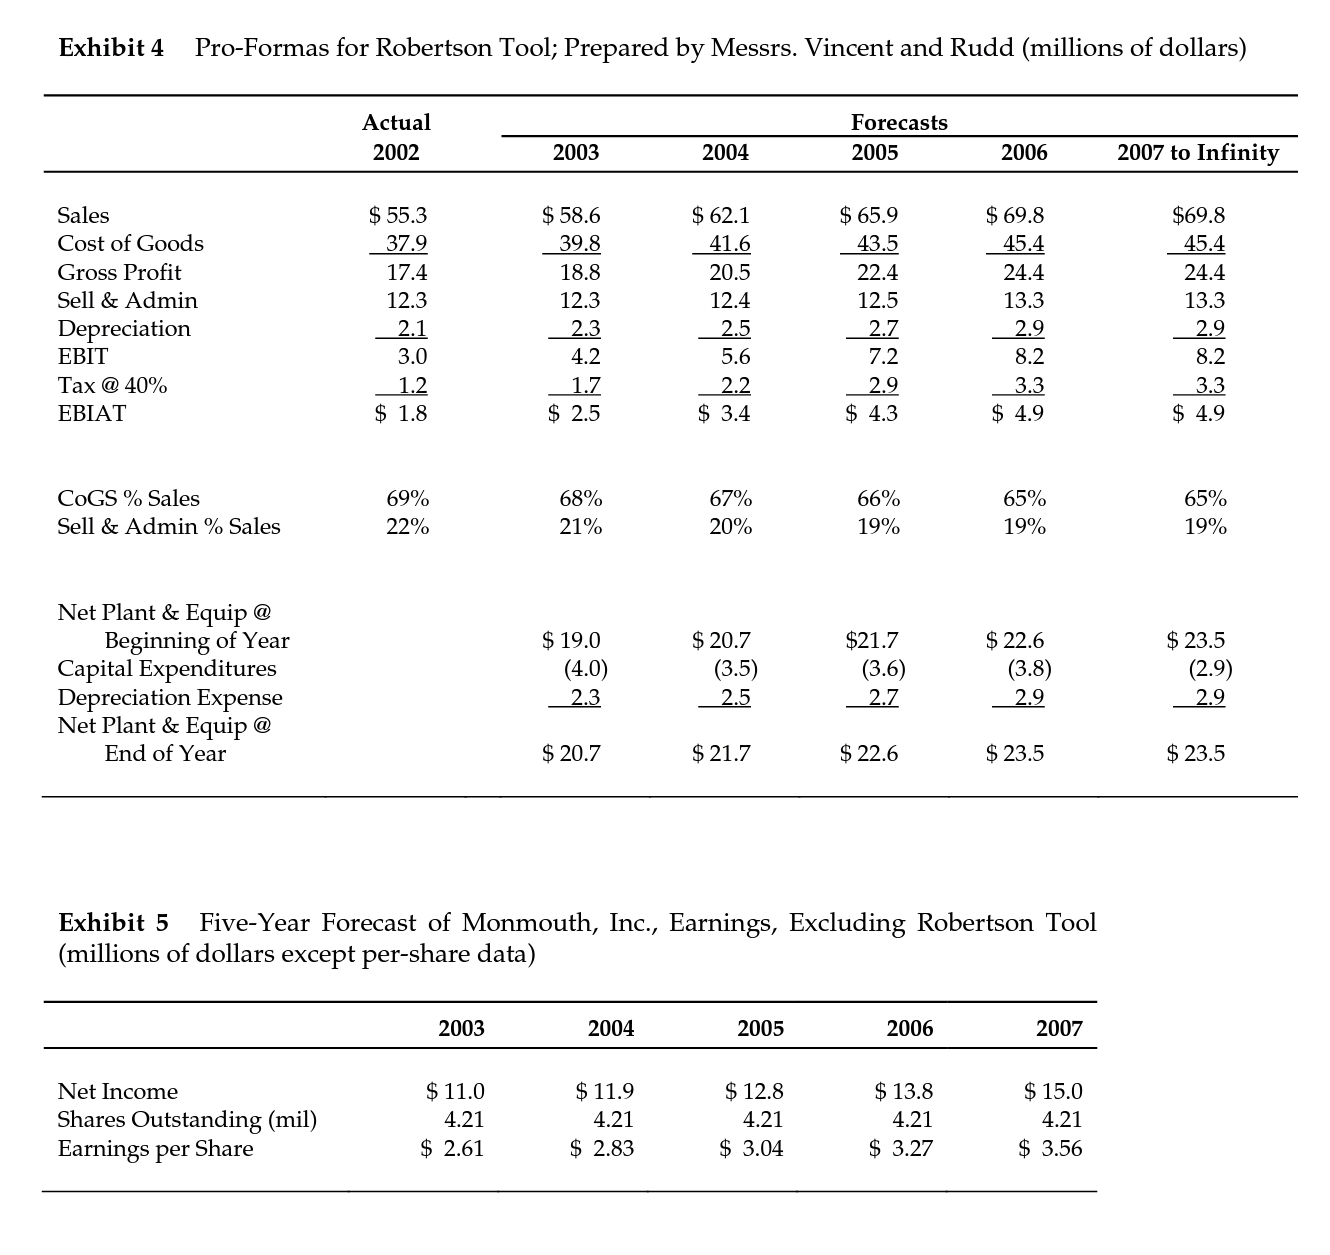
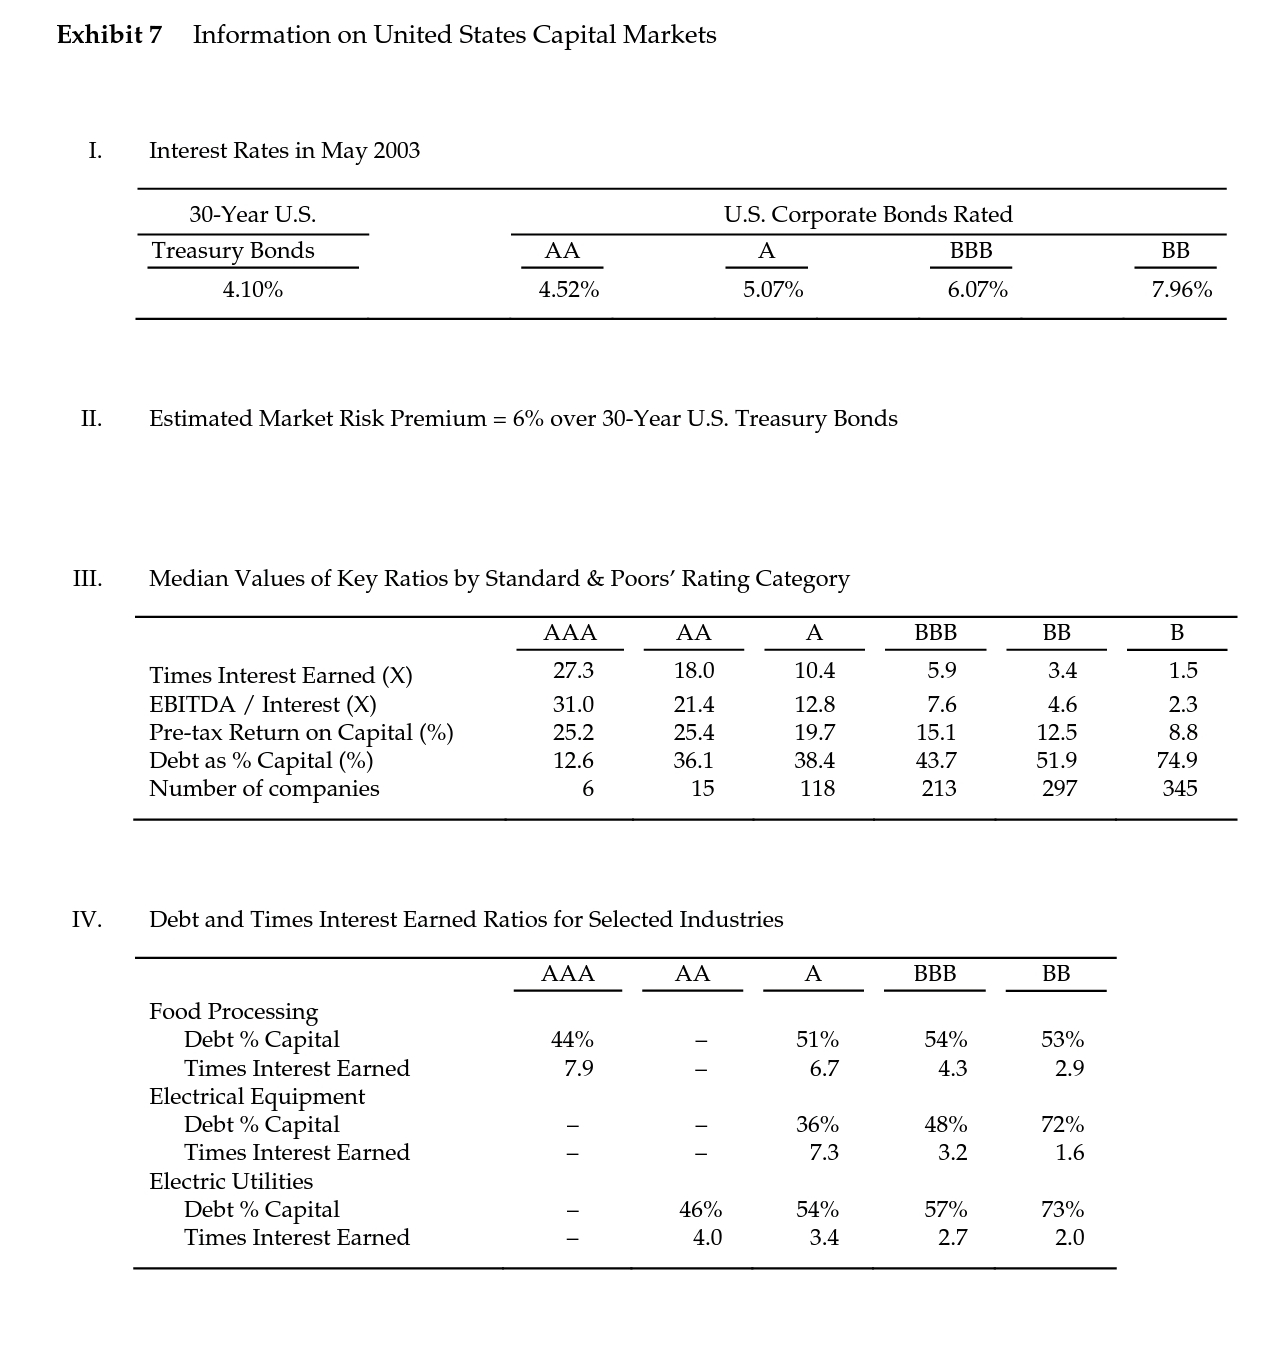
Simulate a RTC buyout and recommend a price based upon capital structure consisting of 30% equity, 45% bank debt (@5% interest) and 25% subordinated debt (@ 8.5% interest).


Step by Step Solution
There are 3 Steps involved in it
Step: 1

Get Instant Access to Expert-Tailored Solutions
See step-by-step solutions with expert insights and AI powered tools for academic success
Step: 2

Step: 3

Ace Your Homework with AI
Get the answers you need in no time with our AI-driven, step-by-step assistance
Get Started


