Question
Exhibit 1 - Income Statement and Balance Sheet Income Statement ($000) Exhibit 2 - Project Details Investment in new machinery $7,000,000 Expected working life of
Exhibit 1 - Income Statement and Balance Sheet
Income Statement ($000)
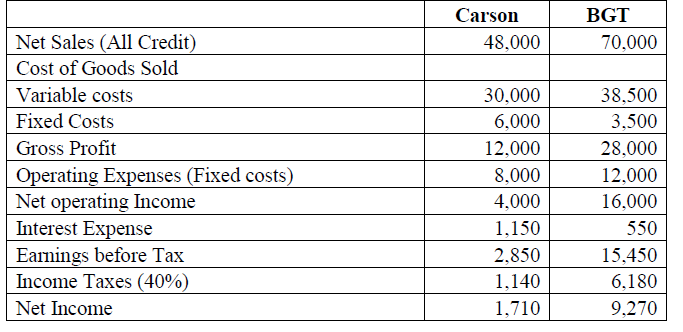
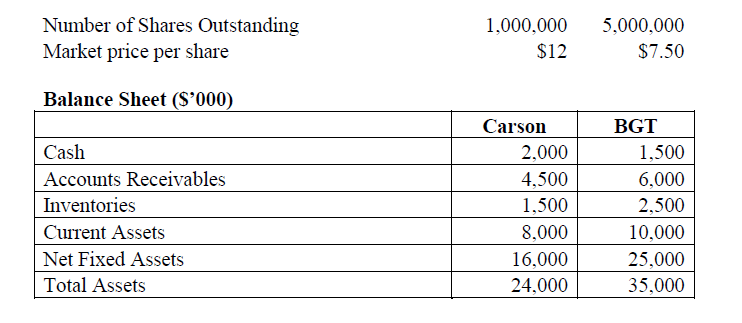
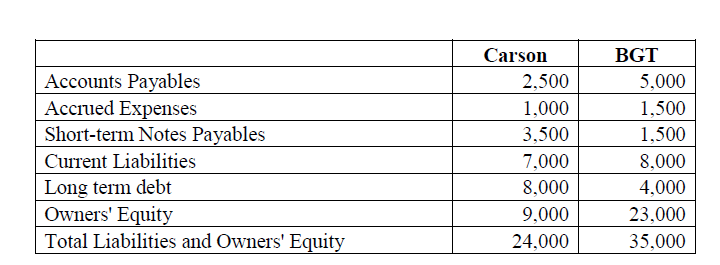
Exhibit 2 - Project Details Investment in new machinery $7,000,000 Expected working life of machinery 7 years The machinery will be depreciated over its life using straight line depreciation Life of the project 4 years Annual sales 1,100,000 units Unit selling price $20 Variable costs 75% Fixed costs $2,000,000 At end of project life, expected selling price of the machinery $2,500,000 Tax rate 40% Working capital 20% of sales to be provided at the start of the project and recouped at the end of the project.

Question 3 (a) For the new product that is being contemplated, appraise the following: (i) Break-even point in sales (ii) Cash flow break-even point (b) Analyse the difference between the following: (i) Break-even point and cash flow break-even point (ii) Break-even point and NPV break-even point
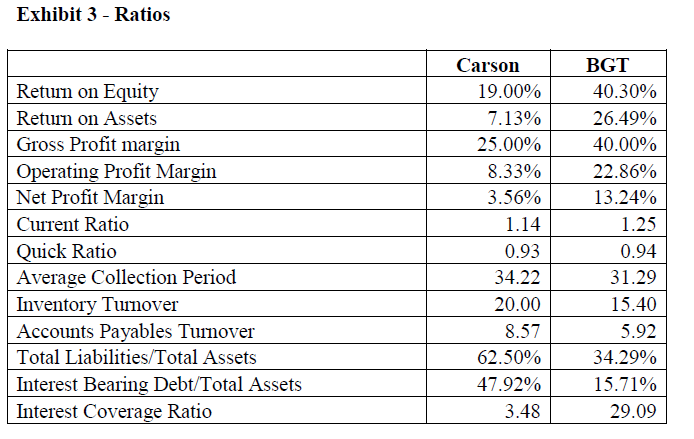
Carson BGT Net Sales (All Credit Cost of Goods Sold Variable costs Fixed Costs Gross Profit 48,000 70,000 perating Expenses (Fixed costs) Net operating Income Interest Expense Earnings before Tax Income Taxes (40%) Net Income 30,000 6,000 12,000 8,000 4,000 1,150 2.850 1,140 1,710 38,500 3.500 28,000 12,000 16,000 550 15.450 6,180 9,270 Number of Shares Outstanding Market price per share 1.000,0005.000.000 $7.50 $12 Balance Sheet (S'000 Carson BGT Cash Accounts Receivables Inventories Curent Assets Net Fixed Assets Total Assets 2,000 4,500 1,500 8,000 16,000 24,000 1,500 6,000 2,500 10,000 25,000 35,000 Carson BGT Accounts Payables Accrued Expenses Short-term Notes Payables Current Liabilities Long term debt Owners' Equit Total Liabilities and Owners' Equit 2,500 1,000 3,500 7,000 8,000 9,000 24,000 5,000 1,500 1,500 8,000 4,000 23,000 35,000 Exhibit 3 - Ratios Carson BGT 19.00% 7.13% 25.00% 8.33% 3.56% 1.14 0.93 34.22 20.00 8.57 62.50% 47.92% 3.48 40.30% 26.49% 40.00% 22.86% 13.24% 1.25 0.94 31.29 15.40 5.92 34.29% 15.71% 29.09 Returm on Equit Return on Assets Gross Profit margin erating Profit Margin Net Profit Margin Current Ratio uick Ratio Average Collection Period Inventory Turnover Accounts Payables Tumovei Total Liabilities/Total Assets Interest Bearing Debt/Total Assets Interest Coverage Ratio Carson | BG Earnings per share Price/Earnings Ratio Total Asset Turnover Equity Multiplier Fixed asset turnover Working capital turover 7.02 2.00 2.67 3 10.67 $1.85 4.05 2.00 1.52 2.8 20.00Step by Step Solution
There are 3 Steps involved in it
Step: 1

Get Instant Access to Expert-Tailored Solutions
See step-by-step solutions with expert insights and AI powered tools for academic success
Step: 2

Step: 3

Ace Your Homework with AI
Get the answers you need in no time with our AI-driven, step-by-step assistance
Get Started


