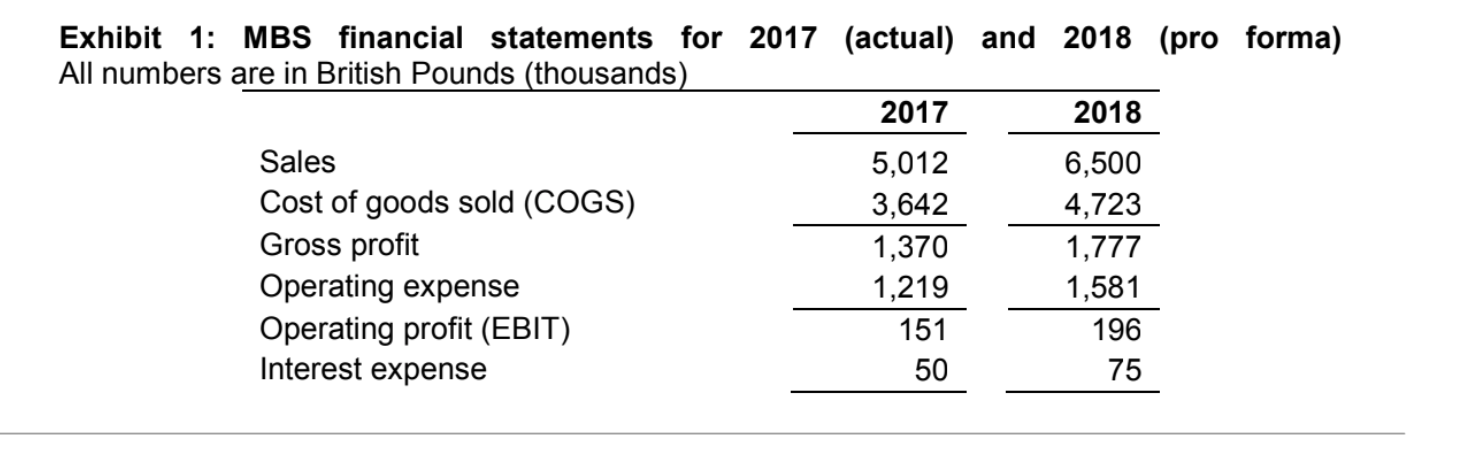
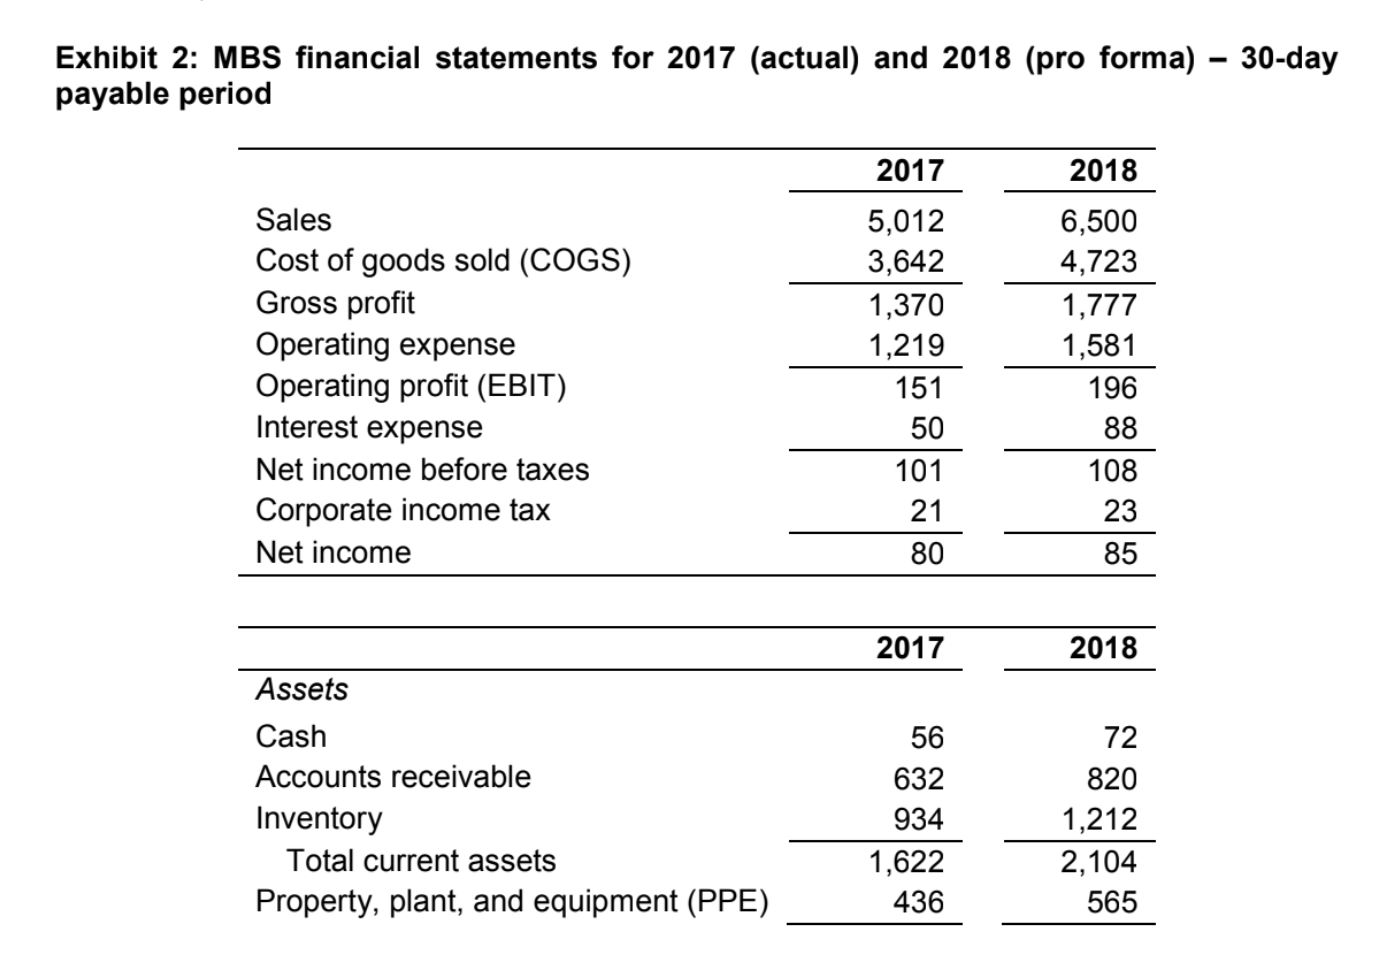
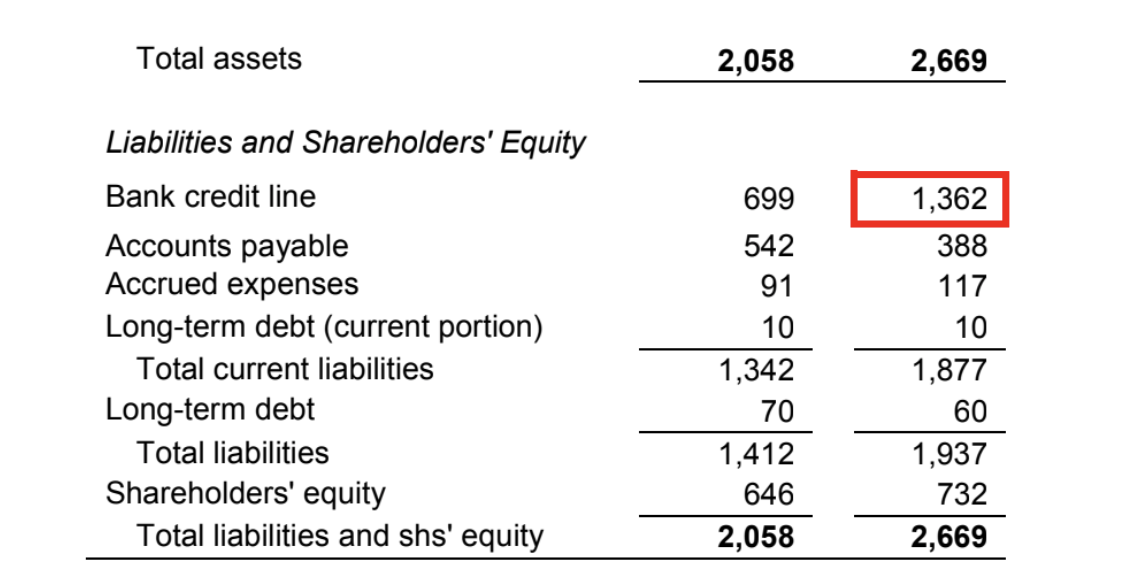
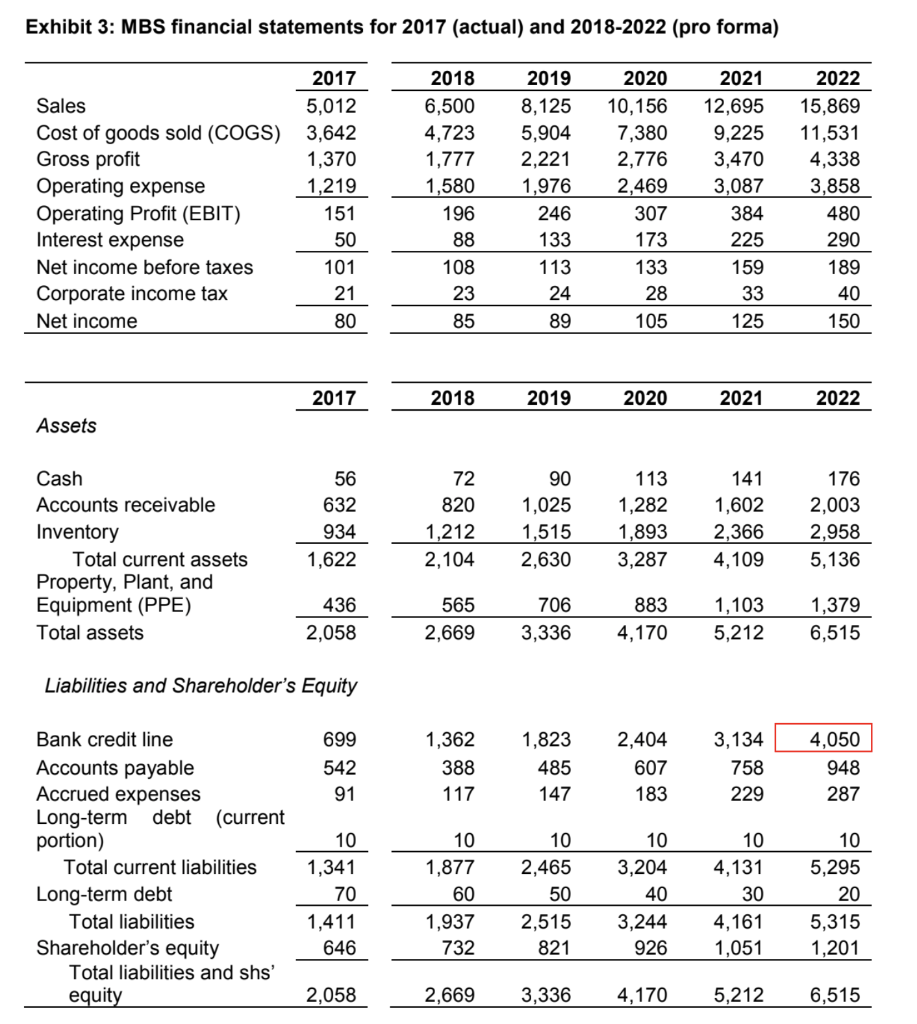
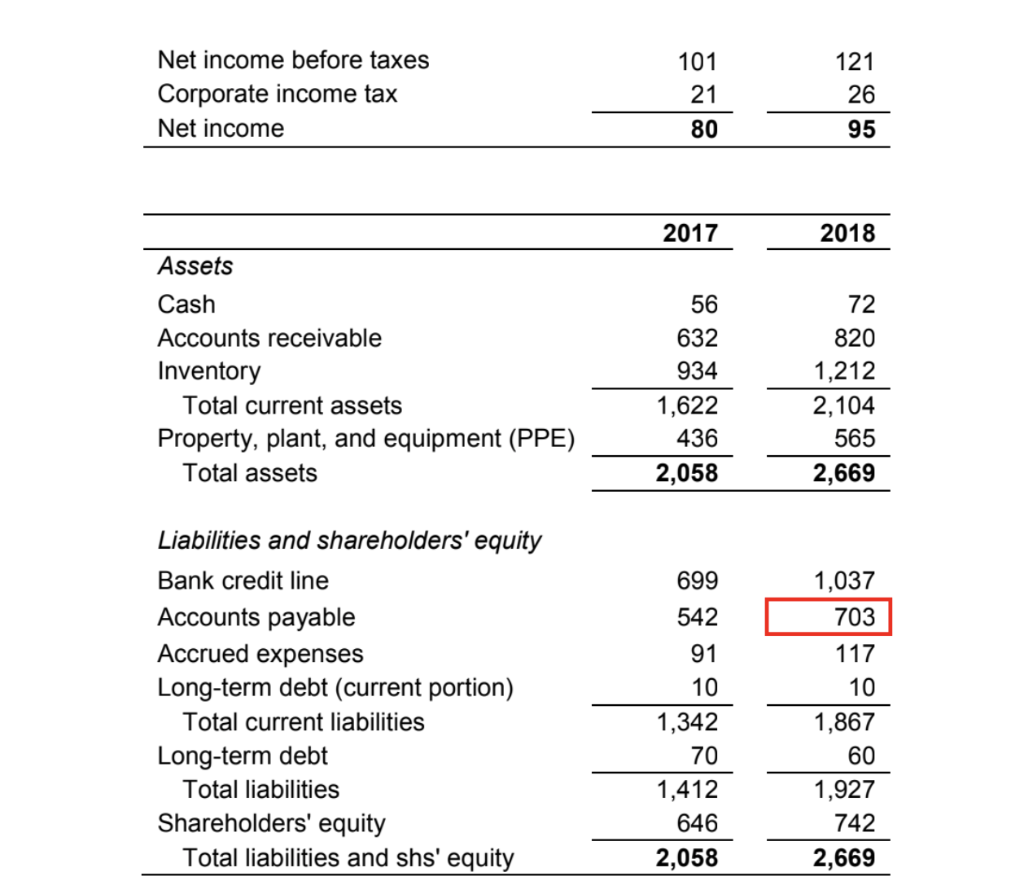

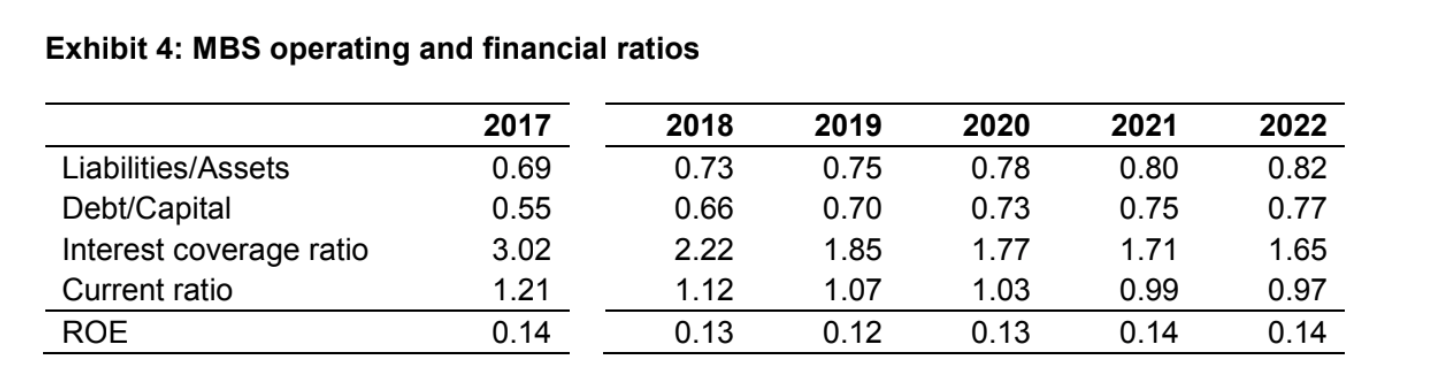
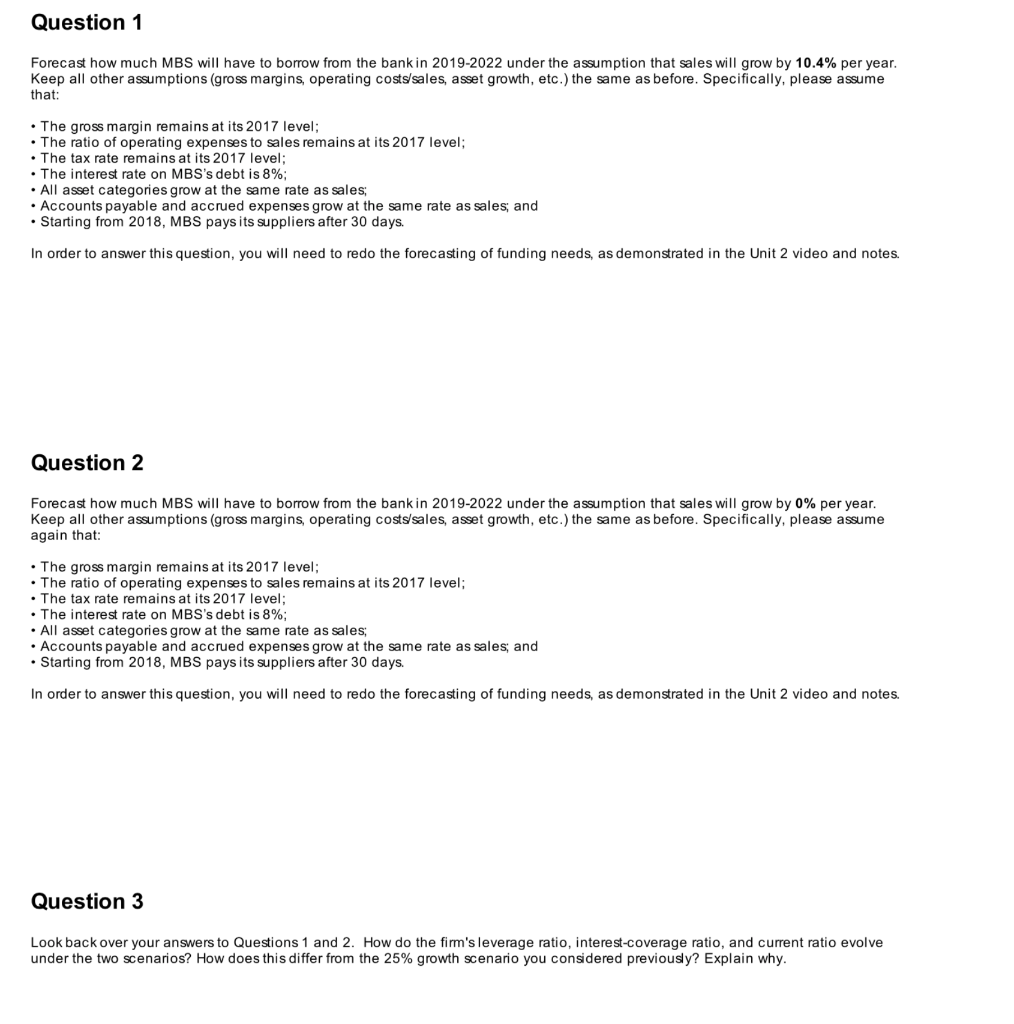
Exhibit 1: MBS financial statements for 2017 (actual) and 2018 (pro forma) All numbers are in British Pounds (thousands) 2017 2018 Sales 5,012 6,500 Cost of goods sold (COGS) 3,642 4,723 Gross profit 1,370 1,777 Operating expense 1,219 1,581 Operating profit (EBIT) 151 196 Interest expense 50 75 Exhibit 2: MBS financial statements for 2017 (actual) and 2018 (pro forma) 30-day payable period 2017 2018 Sales Cost of goods sold (COGS) Gross profit Operating expense Operating profit (EBIT) Interest expense Net income before taxes Corporate income tax Net income 5,012 3,642 1,370 1,219 151 50 101 21 80 6,500 4,723 1,777 1,581 196 88 108 23 85 2017 2018 Assets Cash Accounts receivable Inventory Total current assets Property, plant, and equipment (PPE) 56 632 934 1,622 436 72 820 1,212 2,104 565 Total assets 2,058 2,669 Liabilities and Shareholders' Equity Bank credit line Accounts payable Accrued expenses Long-term debt (current portion) Total current liabilities Long-term debt Total liabilities Shareholders' equity Total liabilities and shs' equity 699 542 91 10 1,342 70 1,412 646 2,058 1,362 388 117 10 1,877 60 1,937 732 2,669 Exhibit 3: MBS financial statements for 2017 (actual) and 2018-2022 (pro forma) 2017 Sales 5,012 Cost of goods sold (COGS) 3,642 Gross profit 1,370 Operating expense 1,219 Operating Profit (EBIT) 151 Interest expense 50 Net income before taxes 101 Corporate income tax 21 Net income 80 2018 6,500 4,723 1,777 1,580 196 88 108 23 85 2019 8,125 5,904 2,221 1,976 246 133 113 24 89 2020 10,156 7,380 2,776 2.469 307 173 133 28 105 2021 12,695 9,225 3,470 3.087 384 225 159 33 125 2022 15,869 11,531 4,338 3,858 480 290 189 40 150 2017 2018 2019 2020 2021 2022 Assets Cash Accounts receivable Inventory Total current assets Property, Plant, and Equipment (PPE) Total assets 56 632 934 1,622 72 820 1,212 2,104 90 1,025 1,515 2,630 113 1,282 1,893 3,287 141 1,602 2,366 4,109 176 2,003 2,958 5,136 436 2,058 565 2,669 706 3,336 883 4,170 1,103 5,212 1,379 6,515 Liabilities and Shareholder's Equity 699 542 91 1,362 388 117 1,823 485 147 2,404 607 183 3,134 758 229 4,050 948 287 10 10 Bank credit line Accounts payable Accrued expenses Long-term debt (current portion) Total current liabilities Long-term debt Total liabilities Shareholder's equity Total liabilities and shs' equity 10 1,341 70 1,411 646 1,877 60 1,937 732 10 2,465 50 2,515 821 10 3,204 40 3,244 926 4,131 30 4,161 1,051 10 5,295 20 5,315 1,201 2,058 2,669 3,336 4,170 5,212 6,515 Net income before taxes Corporate income tax Net income 101 21 121 26 95 80 2017 2018 56 632 Assets Cash Accounts receivable Inventory Total current assets Property, plant, and equipment (PPE) Total assets 934 1,622 436 2,058 72 820 1,212 2,104 565 2,669 Liabilities and shareholders' equity Bank credit line Accounts payable Accrued expenses Long-term debt (current portion) Total current liabilities Long-term debt Total liabilities Shareholders' equity Total liabilities and shs' equity 699 542 91 10 1,342 70 1,412 646 2,058 1,037 703 117 10 1,867 60 1,927 742 2,669 Net income before taxes Corporate income tax Net income 101 21 121 26 95 80 2017 2018 56 632 Assets Cash Accounts receivable Inventory Total current assets Property, plant, and equipment (PPE) Total assets 934 1,622 436 2,058 72 820 1,212 2,104 565 2,669 Liabilities and shareholders' equity Bank credit line Accounts payable Accrued expenses Long-term debt (current portion) Total current liabilities Long-term debt Total liabilities Shareholders' equity Total liabilities and shs' equity 699 542 91 10 1,342 70 1,412 646 2,058 1,037 703 117 10 1,867 60 1,927 742 2,669 Exhibit 4: MBS operating and financial ratios Liabilities/Assets Debt/Capital Interest coverage ratio Current ratio ROE 2017 0.69 0.55 3.02 1.21 0.14 2018 0.73 0.66 2.22 1.12 0.13 2019 0.75 0.70 1.85 1.07 0.12 2020 0.78 0.73 1.77 1.03 0.13 2021 0.80 0.75 1.71 0.99 0.14 2022 0.82 0.77 1.65 0.97 0.14 Question 1 Forecast how much MBS will have to borrow from the bank in 2019-2022 under the assumption that sales will grow by 10.4% per year. Keep all other assumptions (gross margins, operating costs/sales, asset growth, etc.) the same as before. Specifically, please assume that: The gross margin remains at its 2017 level; The ratio of operating expenses to sales remains at its 2017 level; The tax rate remains at its 2017 level; . The interest rate on MBS's debt is 8%; . All asset categories grow at the same rate as sales; Accounts payable and accrued expenses grow at the same rate as sales, and Starting from 2018, MBS pays its suppliers after 30 days. In order to answer this question, you will need to redo the forecasting of funding needs, as demonstrated in the Unit 2 video and notes. Quest 2 Forecast how much MBS will have to borrow from the bank in 2019-2022 under the assumption that sales will grow by 0% per year. Keep all other assumptions (gross margins, operating costs/sales, asset growth, etc.) the same as before. Specifically, please assume again that: The gross margin remains at its 2017 level; The ratio of operating expenses to sales remains at its 2017 level; . The tax rate remains at its 2017 level; The interest rate on MBS's debt is 8%; All asset categories grow at the same rate as sales: Accounts payable and accrued expenses grow at the same rate as sales and Starting from 2018, MBS pays its suppliers after 30 days. In order to answer this question, you will need to redo the forecasting of funding needs, as demonstrated in the Unit 2 video and notes. Question 3 Look back over your answers to Questions 1 and 2. How do the firm's leverage ratio, interest-Coverage ratio, and current ratio evolve under the two scenarios? How does this differ from the 25% growth scenario you considered previously? Explain why. Exhibit 1: MBS financial statements for 2017 (actual) and 2018 (pro forma) All numbers are in British Pounds (thousands) 2017 2018 Sales 5,012 6,500 Cost of goods sold (COGS) 3,642 4,723 Gross profit 1,370 1,777 Operating expense 1,219 1,581 Operating profit (EBIT) 151 196 Interest expense 50 75 Exhibit 2: MBS financial statements for 2017 (actual) and 2018 (pro forma) 30-day payable period 2017 2018 Sales Cost of goods sold (COGS) Gross profit Operating expense Operating profit (EBIT) Interest expense Net income before taxes Corporate income tax Net income 5,012 3,642 1,370 1,219 151 50 101 21 80 6,500 4,723 1,777 1,581 196 88 108 23 85 2017 2018 Assets Cash Accounts receivable Inventory Total current assets Property, plant, and equipment (PPE) 56 632 934 1,622 436 72 820 1,212 2,104 565 Total assets 2,058 2,669 Liabilities and Shareholders' Equity Bank credit line Accounts payable Accrued expenses Long-term debt (current portion) Total current liabilities Long-term debt Total liabilities Shareholders' equity Total liabilities and shs' equity 699 542 91 10 1,342 70 1,412 646 2,058 1,362 388 117 10 1,877 60 1,937 732 2,669 Exhibit 3: MBS financial statements for 2017 (actual) and 2018-2022 (pro forma) 2017 Sales 5,012 Cost of goods sold (COGS) 3,642 Gross profit 1,370 Operating expense 1,219 Operating Profit (EBIT) 151 Interest expense 50 Net income before taxes 101 Corporate income tax 21 Net income 80 2018 6,500 4,723 1,777 1,580 196 88 108 23 85 2019 8,125 5,904 2,221 1,976 246 133 113 24 89 2020 10,156 7,380 2,776 2.469 307 173 133 28 105 2021 12,695 9,225 3,470 3.087 384 225 159 33 125 2022 15,869 11,531 4,338 3,858 480 290 189 40 150 2017 2018 2019 2020 2021 2022 Assets Cash Accounts receivable Inventory Total current assets Property, Plant, and Equipment (PPE) Total assets 56 632 934 1,622 72 820 1,212 2,104 90 1,025 1,515 2,630 113 1,282 1,893 3,287 141 1,602 2,366 4,109 176 2,003 2,958 5,136 436 2,058 565 2,669 706 3,336 883 4,170 1,103 5,212 1,379 6,515 Liabilities and Shareholder's Equity 699 542 91 1,362 388 117 1,823 485 147 2,404 607 183 3,134 758 229 4,050 948 287 10 10 Bank credit line Accounts payable Accrued expenses Long-term debt (current portion) Total current liabilities Long-term debt Total liabilities Shareholder's equity Total liabilities and shs' equity 10 1,341 70 1,411 646 1,877 60 1,937 732 10 2,465 50 2,515 821 10 3,204 40 3,244 926 4,131 30 4,161 1,051 10 5,295 20 5,315 1,201 2,058 2,669 3,336 4,170 5,212 6,515 Net income before taxes Corporate income tax Net income 101 21 121 26 95 80 2017 2018 56 632 Assets Cash Accounts receivable Inventory Total current assets Property, plant, and equipment (PPE) Total assets 934 1,622 436 2,058 72 820 1,212 2,104 565 2,669 Liabilities and shareholders' equity Bank credit line Accounts payable Accrued expenses Long-term debt (current portion) Total current liabilities Long-term debt Total liabilities Shareholders' equity Total liabilities and shs' equity 699 542 91 10 1,342 70 1,412 646 2,058 1,037 703 117 10 1,867 60 1,927 742 2,669 Net income before taxes Corporate income tax Net income 101 21 121 26 95 80 2017 2018 56 632 Assets Cash Accounts receivable Inventory Total current assets Property, plant, and equipment (PPE) Total assets 934 1,622 436 2,058 72 820 1,212 2,104 565 2,669 Liabilities and shareholders' equity Bank credit line Accounts payable Accrued expenses Long-term debt (current portion) Total current liabilities Long-term debt Total liabilities Shareholders' equity Total liabilities and shs' equity 699 542 91 10 1,342 70 1,412 646 2,058 1,037 703 117 10 1,867 60 1,927 742 2,669 Exhibit 4: MBS operating and financial ratios Liabilities/Assets Debt/Capital Interest coverage ratio Current ratio ROE 2017 0.69 0.55 3.02 1.21 0.14 2018 0.73 0.66 2.22 1.12 0.13 2019 0.75 0.70 1.85 1.07 0.12 2020 0.78 0.73 1.77 1.03 0.13 2021 0.80 0.75 1.71 0.99 0.14 2022 0.82 0.77 1.65 0.97 0.14 Question 1 Forecast how much MBS will have to borrow from the bank in 2019-2022 under the assumption that sales will grow by 10.4% per year. Keep all other assumptions (gross margins, operating costs/sales, asset growth, etc.) the same as before. Specifically, please assume that: The gross margin remains at its 2017 level; The ratio of operating expenses to sales remains at its 2017 level; The tax rate remains at its 2017 level; . The interest rate on MBS's debt is 8%; . All asset categories grow at the same rate as sales; Accounts payable and accrued expenses grow at the same rate as sales, and Starting from 2018, MBS pays its suppliers after 30 days. In order to answer this question, you will need to redo the forecasting of funding needs, as demonstrated in the Unit 2 video and notes. Quest 2 Forecast how much MBS will have to borrow from the bank in 2019-2022 under the assumption that sales will grow by 0% per year. Keep all other assumptions (gross margins, operating costs/sales, asset growth, etc.) the same as before. Specifically, please assume again that: The gross margin remains at its 2017 level; The ratio of operating expenses to sales remains at its 2017 level; . The tax rate remains at its 2017 level; The interest rate on MBS's debt is 8%; All asset categories grow at the same rate as sales: Accounts payable and accrued expenses grow at the same rate as sales and Starting from 2018, MBS pays its suppliers after 30 days. In order to answer this question, you will need to redo the forecasting of funding needs, as demonstrated in the Unit 2 video and notes. Question 3 Look back over your answers to Questions 1 and 2. How do the firm's leverage ratio, interest-Coverage ratio, and current ratio evolve under the two scenarios? How does this differ from the 25% growth scenario you considered previously? Explain why