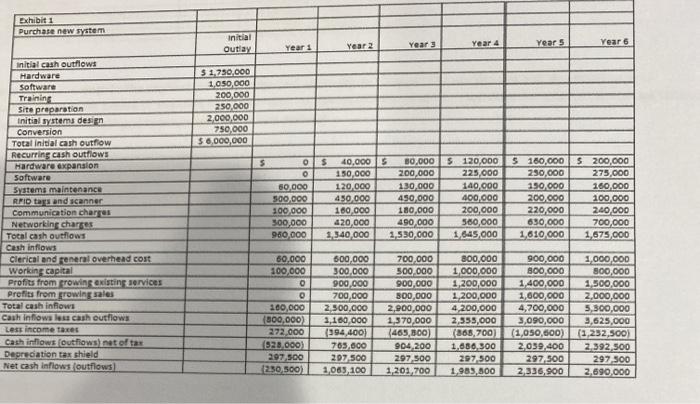
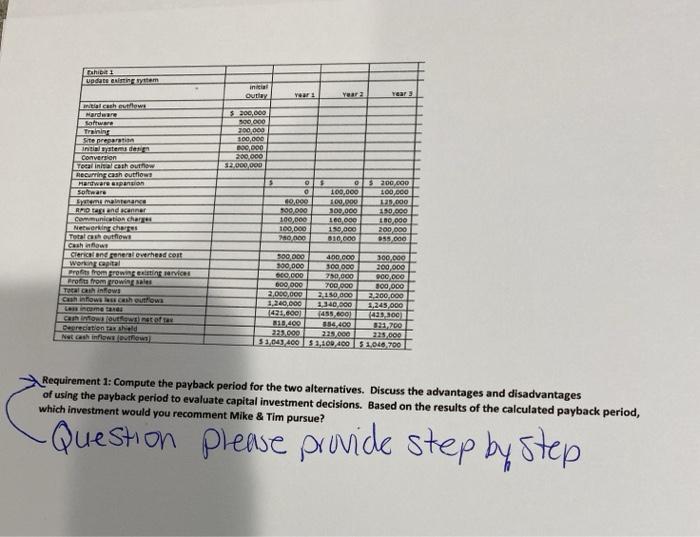
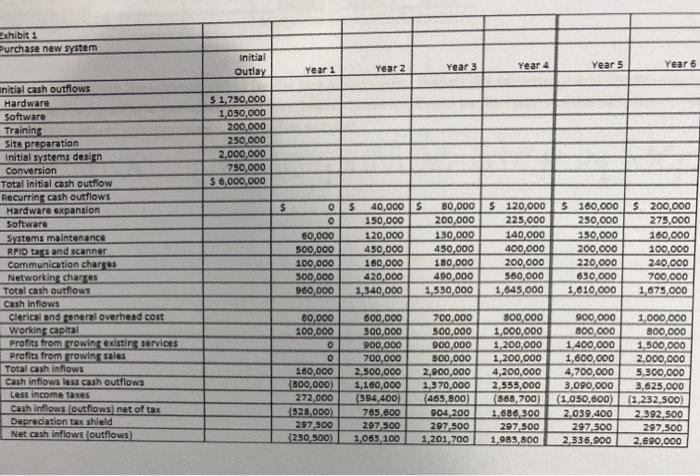
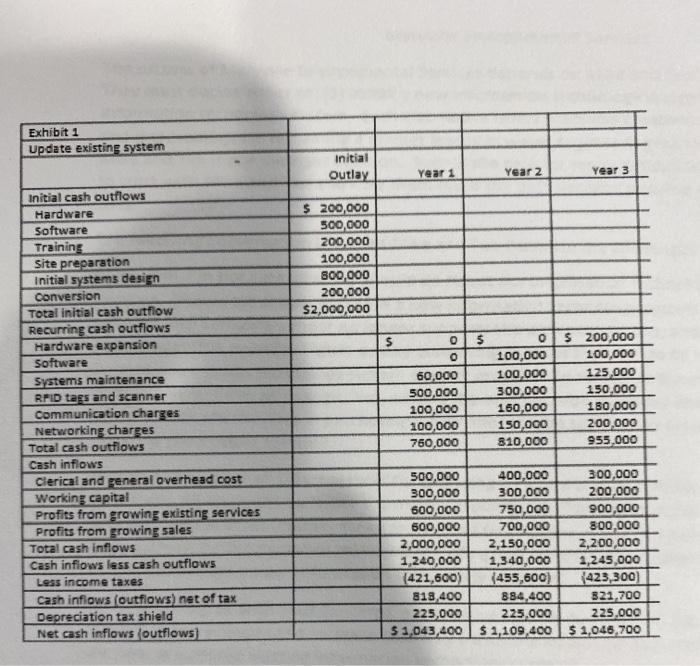
Exhibit 1 Purchase new system Initial Outlay Year 5 Year 4 Years Year 6 Year 1 Year 2 5 1.750,000 1.050 000 200,000 250,000 2,000,000 750,000 $6,000,000 5 olo Initial cash outflows Hardware Software Training Site preparation Initial systems desin Conversion Total initial cash outflow Recurring cash outflows Hardware expansion Software Systems maintenance RFID tags and scanner Communication charges Networking charges Total cash outflows Cash inflows Clerical and reneral overhead cost Working capital Profits from growing existing services Prefits from growing sales Total cash inflows Cash inflows le cash outflows Lese income taxes Cash inflows foutflows net of tax Depreciation tax shield Net cash inflows outflows] 80,000 500.000 300,000 300,000 980,000 $ 40,000S 30,000 $120,000 150,000 200,000 225,000 120.000 130,000 140.000 450.000 450,000 400,000 160.000 180,000 200,000 420.000 490,000 580,000 1.340,000 1,530,000 1.545.000 $ 160,000 $200,000 250,000 275,000 150.000 160,000 200.000 100.000 220.000 240.000 630,000 700,000 1.810 000 1,675,000 60.000 100,000 O O 200,000 (300,000) 272,000 (528,000) 297,500 250.300) 500,000 300,000 900,000 700,000 2,300,000 2,160,000 (394,400) 765,600 207,500 1,065 100 700,000 500.000 900.000 300,000 2,900,000 1,370,000 465,800) 904 200 297,500 1,201,700 800,000 1,000,000 1,200,000 1,200,000 4,200,000 2,355,000 (868,700) 1.680 300 297 500 1.983,800 900,000 1,000,000 800,000 800,000 1,400,000 1,500,000 1,600,000 2,000,000 4,700,000 5,300,000 3,090,000 3,625,000 (1,050,000) (1,232,500) 2,039,400 2.392 500 297,500 297, 300 2,336,900 2,690,000 thibiti update them inicial outlay Y1 Yaara Year tal cash flowe Mardware aftware Training Site preparation Antes de Conversion Tecalinisal cash out how Recurring cash outflow Hardware Capan Software $ 200,000 500 000 200,000 100 000 120,000 200.000 52,000,000 ES os DES200.000 O 100.000 100.000 00.000 100.000 12.000 900.000 300.000 190.000 109,000 160.000 110.000 100,000 199,000 200.000 240.000 010,000 955.000 RRORend kenner communication chart Networking cho Tetatch out flows Cashflow Clerichten general overhead cost worn capital Irofits from TOWER rervice rofit from prowie Talinows Can nowe town Lenname te nowotweets Deerection Taxsheld Nutcash interest 500 000 400.000 300,000 300,000 300.000 200 000 SCO,000 750,000 POO OCO 000 000 700.000 300 000 2.000.000 2 150 000 2.200.000 1.240,000 1,340,000 2.245.000 1421.coel 455.600 (429 100 $19,400 1.54 400 021.700 223.000 225.000 225.000 51,049 400 $ 1,100 400 51040 700 Requirement 1: Compute the payback period for the two alternatives. Discuss the advantages and disadvantages of using the payback period to evaluate capital investment decisions. Based on the results of the calculated payback period, which investment would you recomment Mike & Tim pursue? -Question please provide step by step Exhibit 1 Purchase new system Initial Outlay Year 2 Year 1 Year 3 Year 4 Year 5 Year 6 51.750,000 1,050,000 200,000 250.000 2,000,000 750,000 $ 6,000,000 Initial cash outflows Hardware Software Training Site preparation Initial systems design Conversion Total initial cash outflow Recurring cash outflows Hardware expansion Software Systems maintenance RFID tags and scanner Communication charges Networking charges Total cash outflowe Cash inflows Clerical and general overhead cost Working capital Profits from Frowing existing services Profits from growing sales Total cash inflows Cash inflows less cash outflows Les income taxes Cash Inflows foutflows net of tax Depreciation tat shield Net cash inflows outflows] 5 o 60,000 500.000 100,000 300,000 900,000 $ 40,000 $ 80,000 150,000 200.000 120,000 130.000 450,000 450.000 160,000 180,000 420,000 490,000 1,340,000 1.930,000 $ 120,000 225.000 140.000 400 000 200,000 560,000 1.645,000 $ 180,000 250,000 150,000 200.000 220,000 630,000 1,010,000 $ 200,000 275,000 180,000 100,000 240,000 700.000 1,675,000 60,000 100,000 o 160,000 (800,000) 272.000 1520.000 297,500 250, 500) 800,000 300,000 900,000 700,000 2,500,000 1,160,000 (594,400) 765,600 297,500 1,063 100 700.000 500,000 900,000 300,000 2.900.000 1,370,000 (465,800) 904, 200 297,500 2,201 700 800,000 1,000,000 1,200,000 1,200,000 4,200,000 2,355,000 (868,700) 1.686.300 297,500 1.983 800 900,000 800,000 1,400,000 1,600,000 4,700,000 3,090,000 (2,050.600) 2,039,400 297 500 2,336,900 1,000,000 800,000 1,500,000 2,000,000 5,300,000 3,625,000 (1,232,500) 2.392,500 297,500 2,690,000 Exhibit 1 Update existing system initial Outlay Year 1 Year 2 Year 3 $ 200,000 500,000 200,000 100,000 800,000 200,000 $2,000,000 $ Olo Initial cash outflows Hardware Software Training Site preparation Initial systems design Conversion Total initial cash outflow Recurring cash outflows Hardware expansion Software Systems maintenance RFID tags and scanner Communication charges Networking charges Total cash outflows Cash inflows Clerical and Feneral overhead cost Working capital Profits from growing existing services Profits from growing sales Total cash inflows Cash inflows less cash outflows Less income taxes Cash inflows (outflows) net of tax Depreciation tax shield Net cash inflows outflows] 60,000 500,000 100,000 100,000 750,000 o 100,000 100,000 300,000 160,000 150,000 810,000 $ 200,000 100,000 125,000 150,000 180,000 200,000 955,000 500,000 400,000 300,000 300,000 300,000 200,000 600,000 750,000 900,000 500,000 700,000 800,000 2,000,000 2,150,000 2,200,000 1,240,000 1,340,000 2,245,000 (421,600) (455,600) 423,300) 818,400 384,400 821 700 225,000 225,000 225,000 51,043,400 $2,109,400 5 1,046,700 Requirement 1: Compute the payback period for the two alternatives. Discuss the advantages and disadvantages of using the payback period to evaluate capital investment decisions. Based on the results of the calculated payback period, which investment would you recomment Mike & Tim pursue? Question please provide step by step
