

Answered step by step
Verified Expert Solution
Question
1 Approved Answer
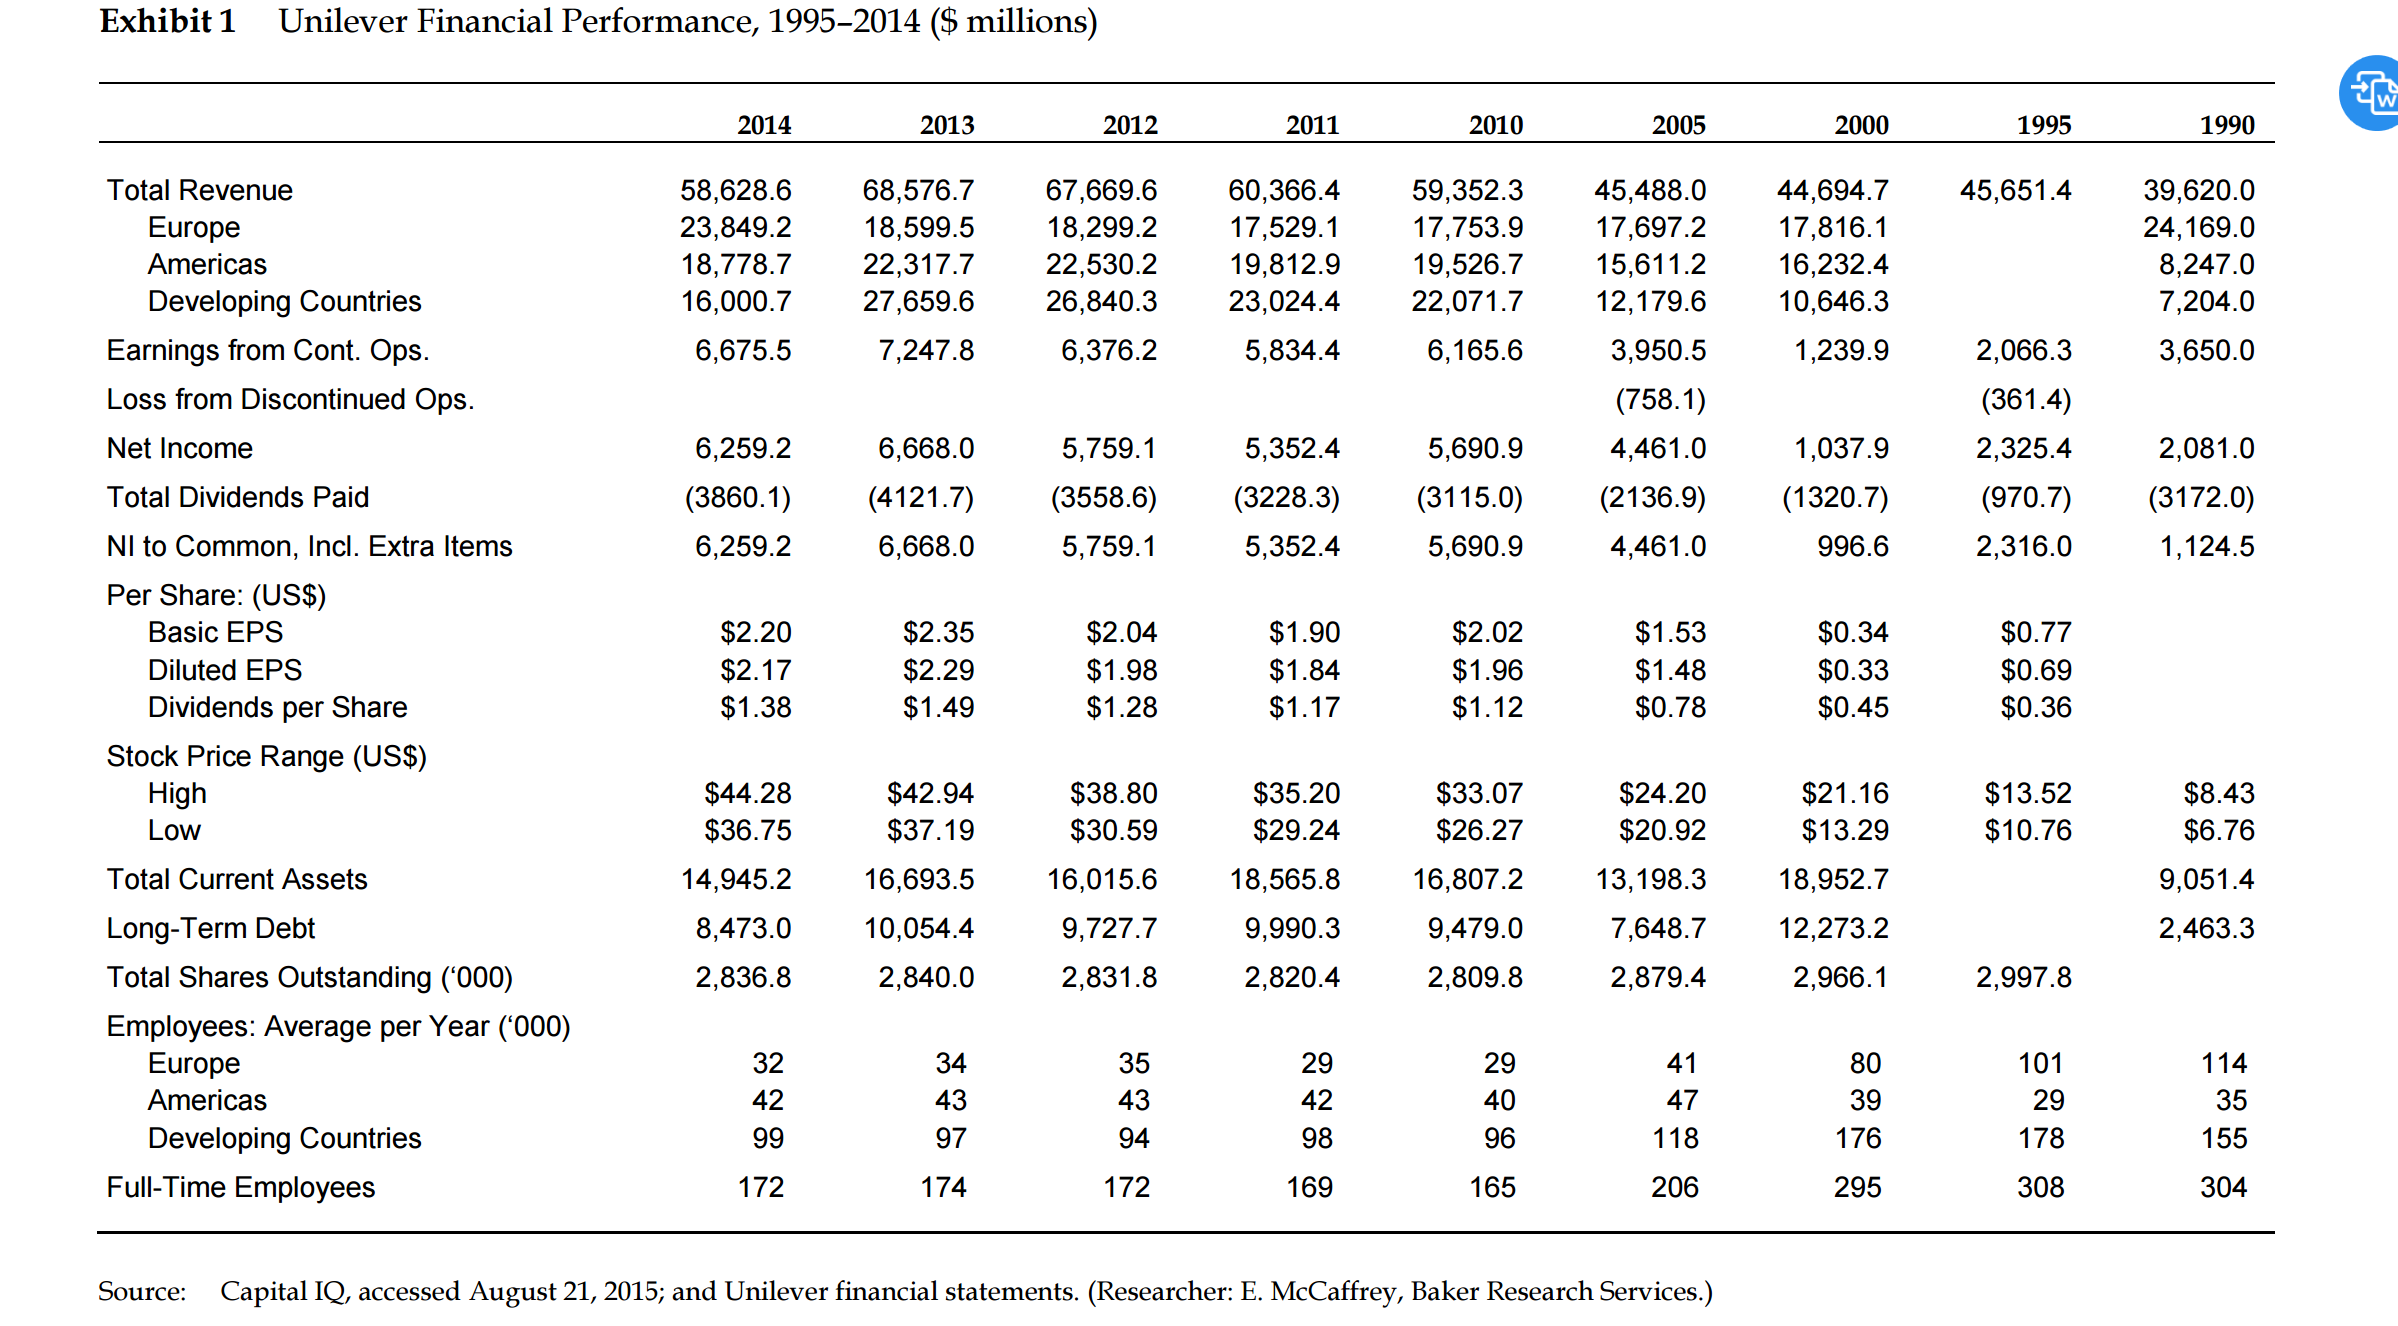
Exhibit 1 Unilever Financial Performance, 1995-2014 ($ millions) 2014 2013 2012 2011 2010 2005 2000 1995 1990 Total Revenue 58,628.6 68,576.7 67,669.6 60,366.4 59,352.3 45,488.0
Step by Step Solution
There are 3 Steps involved in it
Step: 1

Get Instant Access to Expert-Tailored Solutions
See step-by-step solutions with expert insights and AI powered tools for academic success
Step: 2

Step: 3
Ace Your Homework with AI
Get the answers you need in no time with our AI-driven, step-by-step assistance
Get Started
Quantitative Methods For Business
Authors: David Anderson, Dennis Sweeney, Thomas Williams, Jeffrey Cam
11th Edition
978-0324651812, 324651813, 978-0324651751