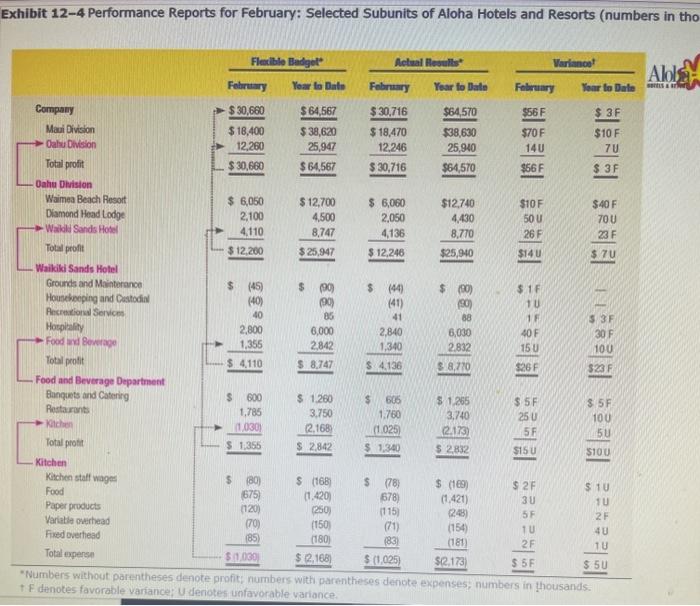
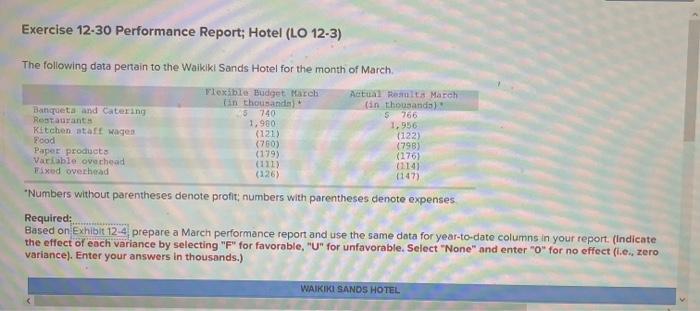
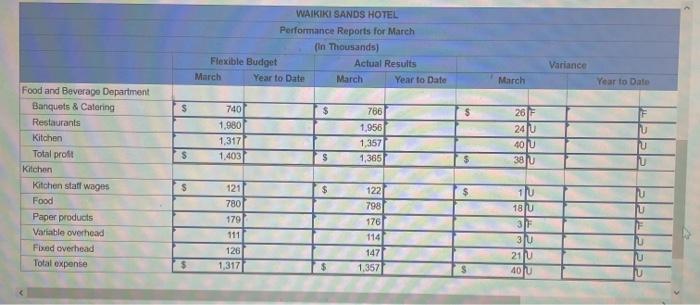
Exhibit 12-4 Performance Reports for February: Selected Subunits of Aloha Hotels and Resorts (numbers in tho Flecible Badget Actual Results Varianco Alois February Year to Date February Year to Date February Your lo Date AS WE 26 F Company $ 30,660 $64,567 $ 30,716 $64,570 $56 F $ 3F Maui Division $ 18,400 $ 38,620 $ 18,470 $38,630 $70F $10 F Oahu Dision 12,260 25,947 12.246 25,940 140 70 Total profit $ 30,660 $ 64,567 $ 30,716 $64,570 $56F $ 3F Oahu Division Waimea Beach Resort 6,050 $ 12,700 $ 6,080 $12.740 $10F $40 F Diamond Head Lodge 2,100 4,500 2,050 4,430 50 U 70U Walk Sands Hotel 4,110 8,747 4,136 8.770 23 F Total profil $ 12,200 $ 25,947 $ 12,246 $25,940 $14U $ 70 Waikiki Sands Hotel Grounds and Maintenance $ $ (190 $ (44) $ (90) $1F Housekeeping and Custodini (40) (90) (41) (90) 10 Recreational Service 40 85 41 88 1 3 3F Hospitality 2,800 6,000 2,840 6,030 40F 30 F -Food und Beverage 1.356 2.842 1.340 2832 15U 100 Total prot $4,110 $ 8,747 $ 4.136 $ 8,770 $26 F 323 F Food and Beverage Department Banquets and Catering $ 600 $ 1.260 S 606 $ 1.265 $ 5F 3.5F Restaurants 1,785 3.750 1.760 3,740 25 U 100 Kichen 11.030) 2.168 (1.025 2.173) 5F 150 Total profit $ 1,355 $ 2.842 $ 1.300 $ 2,832 $150 S10U Kitchen Kitchen staff wages $ (60) $ (168 $ (78) $ 109) $ 2F Food $ 10 1675) (1,420) 678) (1.421) 30 TU Paper products 1720) (250) (115) 248) 5 F 2F Variatie overhead (70) (150) (71) (154 TU 40 Fixed overhead (85) (180) (83) (181) 2F TU Totalspense $11030 $ 2.168 $(1,025) $12.173 $ 5F $ 50 *Numbers without parentheses denote profits numbers with parentheses denote expenses, numbers in thousands + F denotes favorable variance: U denotes unfavorable variance Exercise 12-30 Performance Report; Hotel (LO 12-3) The following data pertain to the Waikiki Sands Hotel for the month of March Flexible Budget Maret Actual Rts March tin thousand in thousands) Banqueta and Catering 5740 5766 Restaurants 1.980 1,956 Kitchen start wagen (121) (122) Food (750) (798) Paper products (179) (176) Varble overhead (11) (114) Fixed overhead (126) (147) "Numbers without parentheses denote profit; numbers with parentheses denote expenses Required: Based on exhibit 12-4 prepare a March performance report and use the same data for year-to-date columns in your report. (Indicate the effect of each variance by selecting "F" for favorable, "U" for unfavorable. Select "None" and enter "o" for no effect (i.e., zero variance). Enter your answers in thousands.) WAIKIKI SANDS HOTEL WAIKIKI SANDS HOTEL Performance Reports for March (in Thousands) Flexible Budget Actual Results March Year to Date March Year to Date Variance March Year to Dato $ 740 $ F 1.980 766 1,956 1,357 1,365 1,317 1.4031 26 F 240 40U 38 U U U $ S $ Food and Beverage Department Banquets & Catering Restaurants Kitchen Total profit Kitchen Kitchen staff wages Food Paper products Variable overhead Fixed overhead Total expense $ $ 121 780 1791 111 126 1,317 122 798 176 114 147 1,357 TU 18U 31F 310 21 [u TEC 5 $ 4010 Exhibit 12-4 Performance Reports for February: Selected Subunits of Aloha Hotels and Resorts (numbers in tho Flecible Badget Actual Results Varianco Alois February Year to Date February Year to Date February Your lo Date AS WE 26 F Company $ 30,660 $64,567 $ 30,716 $64,570 $56 F $ 3F Maui Division $ 18,400 $ 38,620 $ 18,470 $38,630 $70F $10 F Oahu Dision 12,260 25,947 12.246 25,940 140 70 Total profit $ 30,660 $ 64,567 $ 30,716 $64,570 $56F $ 3F Oahu Division Waimea Beach Resort 6,050 $ 12,700 $ 6,080 $12.740 $10F $40 F Diamond Head Lodge 2,100 4,500 2,050 4,430 50 U 70U Walk Sands Hotel 4,110 8,747 4,136 8.770 23 F Total profil $ 12,200 $ 25,947 $ 12,246 $25,940 $14U $ 70 Waikiki Sands Hotel Grounds and Maintenance $ $ (190 $ (44) $ (90) $1F Housekeeping and Custodini (40) (90) (41) (90) 10 Recreational Service 40 85 41 88 1 3 3F Hospitality 2,800 6,000 2,840 6,030 40F 30 F -Food und Beverage 1.356 2.842 1.340 2832 15U 100 Total prot $4,110 $ 8,747 $ 4.136 $ 8,770 $26 F 323 F Food and Beverage Department Banquets and Catering $ 600 $ 1.260 S 606 $ 1.265 $ 5F 3.5F Restaurants 1,785 3.750 1.760 3,740 25 U 100 Kichen 11.030) 2.168 (1.025 2.173) 5F 150 Total profit $ 1,355 $ 2.842 $ 1.300 $ 2,832 $150 S10U Kitchen Kitchen staff wages $ (60) $ (168 $ (78) $ 109) $ 2F Food $ 10 1675) (1,420) 678) (1.421) 30 TU Paper products 1720) (250) (115) 248) 5 F 2F Variatie overhead (70) (150) (71) (154 TU 40 Fixed overhead (85) (180) (83) (181) 2F TU Totalspense $11030 $ 2.168 $(1,025) $12.173 $ 5F $ 50 *Numbers without parentheses denote profits numbers with parentheses denote expenses, numbers in thousands + F denotes favorable variance: U denotes unfavorable variance Exercise 12-30 Performance Report; Hotel (LO 12-3) The following data pertain to the Waikiki Sands Hotel for the month of March Flexible Budget Maret Actual Rts March tin thousand in thousands) Banqueta and Catering 5740 5766 Restaurants 1.980 1,956 Kitchen start wagen (121) (122) Food (750) (798) Paper products (179) (176) Varble overhead (11) (114) Fixed overhead (126) (147) "Numbers without parentheses denote profit; numbers with parentheses denote expenses Required: Based on exhibit 12-4 prepare a March performance report and use the same data for year-to-date columns in your report. (Indicate the effect of each variance by selecting "F" for favorable, "U" for unfavorable. Select "None" and enter "o" for no effect (i.e., zero variance). Enter your answers in thousands.) WAIKIKI SANDS HOTEL WAIKIKI SANDS HOTEL Performance Reports for March (in Thousands) Flexible Budget Actual Results March Year to Date March Year to Date Variance March Year to Dato $ 740 $ F 1.980 766 1,956 1,357 1,365 1,317 1.4031 26 F 240 40U 38 U U U $ S $ Food and Beverage Department Banquets & Catering Restaurants Kitchen Total profit Kitchen Kitchen staff wages Food Paper products Variable overhead Fixed overhead Total expense $ $ 121 780 1791 111 126 1,317 122 798 176 114 147 1,357 TU 18U 31F 310 21 [u TEC 5 $ 4010