Answered step by step
Verified Expert Solution
Question
1 Approved Answer
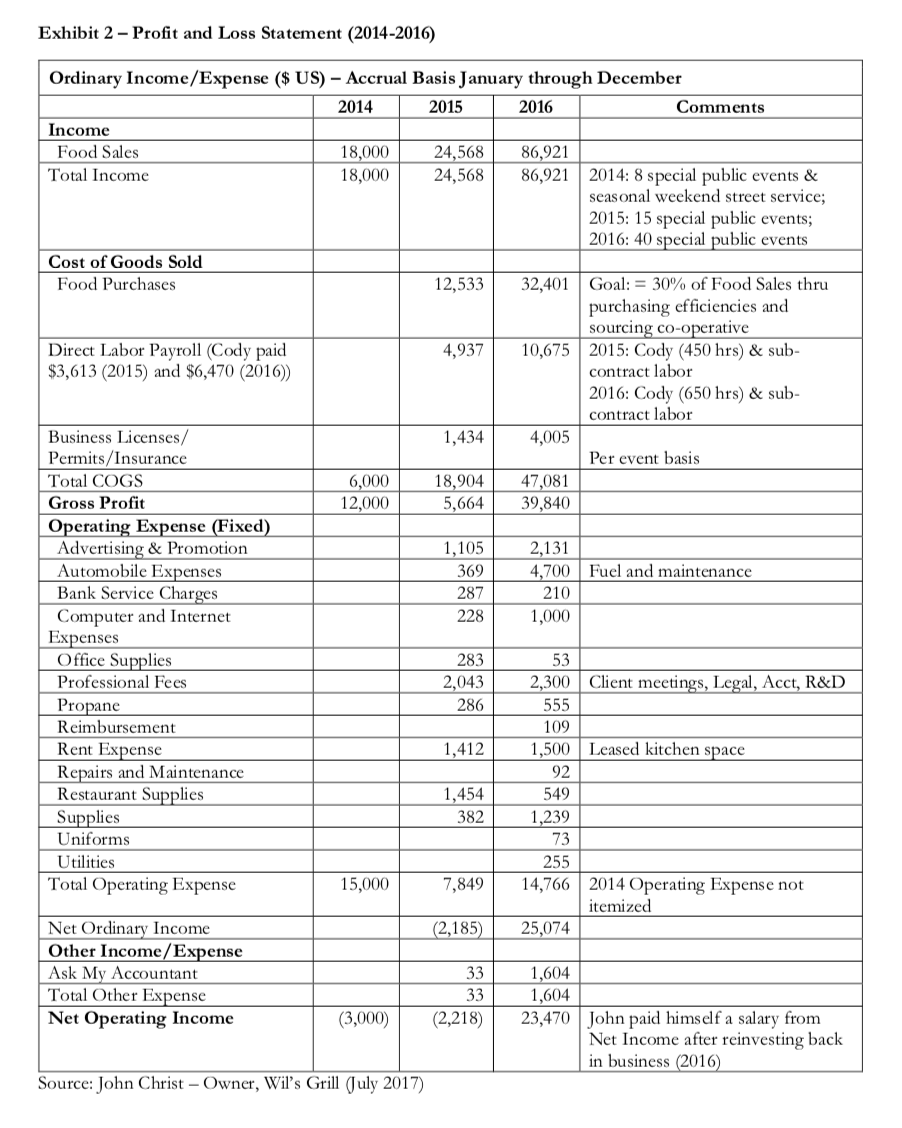
Exhibit 2-Profit and Loss Statement (2014-2016) Ordinary Income/Expense ($ US) Accrual Basis January through December 2014 2015 2016 Comments Income Food Sales 18,000 24,568 86,921


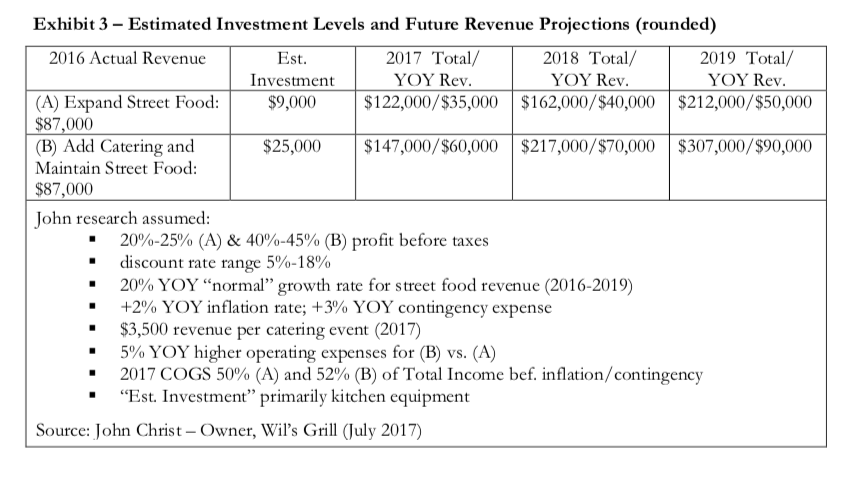
Exhibit 2-Profit and Loss Statement (2014-2016) Ordinary Income/Expense ($ US) Accrual Basis January through December 2014 2015 2016 Comments Income Food Sales 18,000 24,568 86,921 Total Income 18,000 24,568 86,921 2014: 8 special public events & seasonal weekend street service; 2015: 15 special public events; 2016: 40 special public events Cost of Goods Sold Food Purchases 12,533 32,401 Goal: = 30% of Food Sales thru purchasing efficiencies and sourcing co-operative Direct Labor Payroll (Cody paid 4,937 10,675 2015: Cody (450 hrs) & sub- $3,613 (2015) and $6,470 (2016)) contract labor 2016: Cody (650 hrs) & sub- contract labor Business Licenses/ 1,434 4,005 Permits/Insurance Per event basis Total COGS 6,000 18,904 47,081 Gross Profit 12,000 5,664 39,840 Operating Expense (Fixed) Advertising & Promotion 1,105 2,131 Automobile Expenses 369 4,700 Fuel and maintenance Bank Service Charges 287 210 Computer and Internet 228 1,000 Expenses Office Supplies 283 53 Professional Fees 2,300 Client meetings, Legal, Acct, R&D Propane 286 555 Reimbursement 109 Rent Expense 1,500 Leased kitchen space Repairs and Maintenance 92 Restaurant Supplies 1,454 549 Supplies 382 1,239 Uniforms 73 Utilities 255 Total Operating Expense 15,000 7,849 14,766 2014 Operating Expense not itemized Net Ordinary Income (2,185) 25,074 Other Income/Expense Ask My Accountant 33 1,604 Total Other Expense 33 1,604 Net Operating Income (3,000) (2,218) 23,470 John paid himself a salary from Net Income after reinvesting back in business (2016) Source: John Christ Owner, Wil's Grill (July 2017) 2,043 1,412 Exhibit 3 Estimated Investment Levels and Future Revenue Projections (rounded) 2016 Actual Revenue Est. 2017 Total/ 2018 Total/ 2019 Total/ Investment YOY Rev. YOY Rev. YOY Rev. (A) Expand Street Food: $9,000 $122,000/$35,000 $162,000/$40,000 $212,000/$50,000 $ $87,000 (B) Add Catering and $25,000 $147,000/$60,000 $217,000/$70,000 $307,000/$90,000 Maintain Street Food: $87,000 John research assumed: 20%-25% (A) & 40%-45% (B) profit before taxes . discount rate range 5%-18% 20% YOYnormal growth rate for street food revenue (2016-2019) +2% YOY inflation rate; +3% YOY contingency expense $3,500 revenue per catering event (2017) 5% YOY higher operating expenses for (B) vs. (A) 2017 COGS 50% (A) and 52% (B) of Total Income bef. inflation/contingency "Est. Investment" primarily kitchen equipment Source: John Christ - Owner, Wil's Grill (July 2017) Exhibit 2-Profit and Loss Statement (2014-2016) Ordinary Income/Expense ($ US) Accrual Basis January through December 2014 2015 2016 Comments Income Food Sales 18,000 24,568 86,921 Total Income 18,000 24,568 86,921 2014: 8 special public events & seasonal weekend street service; 2015: 15 special public events; 2016: 40 special public events Cost of Goods Sold Food Purchases 12,533 32,401 Goal: = 30% of Food Sales thru purchasing efficiencies and sourcing co-operative Direct Labor Payroll (Cody paid 4,937 10,675 2015: Cody (450 hrs) & sub- $3,613 (2015) and $6,470 (2016)) contract labor 2016: Cody (650 hrs) & sub- contract labor Business Licenses/ 1,434 4,005 Permits/Insurance Per event basis Total COGS 6,000 18,904 47,081 Gross Profit 12,000 5,664 39,840 Operating Expense (Fixed) Advertising & Promotion 1,105 2,131 Automobile Expenses 369 4,700 Fuel and maintenance Bank Service Charges 287 210 Computer and Internet 228 1,000 Expenses Office Supplies 283 53 Professional Fees 2,300 Client meetings, Legal, Acct, R&D Propane 286 555 Reimbursement 109 Rent Expense 1,500 Leased kitchen space Repairs and Maintenance 92 Restaurant Supplies 1,454 549 Supplies 382 1,239 Uniforms 73 Utilities 255 Total Operating Expense 15,000 7,849 14,766 2014 Operating Expense not itemized Net Ordinary Income (2,185) 25,074 Other Income/Expense Ask My Accountant 33 1,604 Total Other Expense 33 1,604 Net Operating Income (3,000) (2,218) 23,470 John paid himself a salary from Net Income after reinvesting back in business (2016) Source: John Christ Owner, Wil's Grill (July 2017) 2,043 1,412 Exhibit 3 Estimated Investment Levels and Future Revenue Projections (rounded) 2016 Actual Revenue Est. 2017 Total/ 2018 Total/ 2019 Total/ Investment YOY Rev. YOY Rev. YOY Rev. (A) Expand Street Food: $9,000 $122,000/$35,000 $162,000/$40,000 $212,000/$50,000 $ $87,000 (B) Add Catering and $25,000 $147,000/$60,000 $217,000/$70,000 $307,000/$90,000 Maintain Street Food: $87,000 John research assumed: 20%-25% (A) & 40%-45% (B) profit before taxes . discount rate range 5%-18% 20% YOYnormal growth rate for street food revenue (2016-2019) +2% YOY inflation rate; +3% YOY contingency expense $3,500 revenue per catering event (2017) 5% YOY higher operating expenses for (B) vs. (A) 2017 COGS 50% (A) and 52% (B) of Total Income bef. inflation/contingency "Est. Investment" primarily kitchen equipment Source: John Christ - Owner, Wil's Grill (July 2017)
Step by Step Solution
There are 3 Steps involved in it
Step: 1

Get Instant Access to Expert-Tailored Solutions
See step-by-step solutions with expert insights and AI powered tools for academic success
Step: 2

Step: 3

Ace Your Homework with AI
Get the answers you need in no time with our AI-driven, step-by-step assistance
Get Started


