Question
EXHIBIT 3 Data of For-Profit Health Care Companies HCA Inc Community Health Health Management Associates Manor Care Triad Hospitals Universal Health Services Revenues (millions) $24,475

EXHIBIT 3 Data of For-Profit Health Care Companies
| HCA Inc | Community Health | Health Management Associates | Manor Care | Triad Hospitals | Universal Health Services | |
| Revenues (millions) | $24,475 | $3,720 | $3,580 | $3,375 | $4,805 | $4,030 |
| Assets (millions) | $5,222 | $961 | $997 | $693 | $1,458 | $775 |
| Total debt (millions) | $9,278 | $1,810 | $1,014 | $857 | $1,703 | $532 |
| Stock Price (S/share) | $52.12 | $39.73 | $23.25 | $39.49 | $41.46 | $49.03 |
| Shares Outstanding (millions) | 452.7 | 88.5 | 247.2 | 78.7 | 84.8 | 54.6 |
| Market Cap (millions) | $23,593 | $3,517 | $5,747 | $3,108 | $3,517 | $2,676 |
| Bond rating | A | B | BB | BB | B | BB |
| Beta | 0.60 | 0.60 | 0.70 | 0.80 | 0.60 | 0.60 |

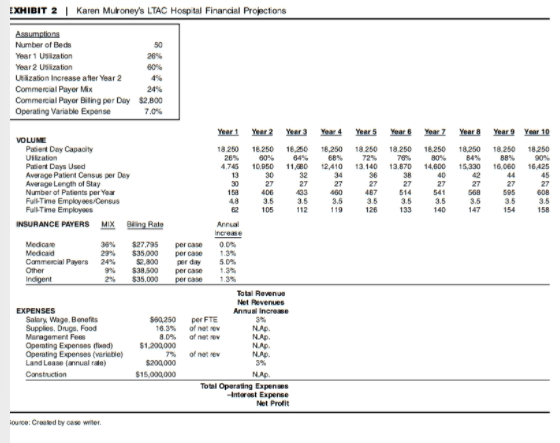
Using the information in the University of Virginia Health Services case, complete the cash flow projections. What are the conclusions of the NPV and IRR of these cash flows?
EXHIBIT 2 Karen Mulroney's LTAC Hospital Financial Projections Number of Beds Year 1 Usization Year 2 Ubization Utization Incresse afer Year 2 Cornmental Player Commecial Payer Biling per Day Operating Variable Expense $2,800 70% Pabient Day Capacity 18 250 25018,250 18,250 18250 18.250 18.250 18250 18250 18250 80% 64% 68% 84% 88% 4745 10.950 11,0 RA10 13140 13.870 14.600 15.330 16.000 16.425 Pabent Days Used Average Patient Census per Dery Average Length ol Slay Number of Patients per Yor 514 3.5 541 3.5 1402.5 3.6 3.5 112 Full-Time Employoes INSURANCE PAYERS Mxing Rale 35% 29% 24% 9% 2% $27.795 $35,000 $2.800 $38.500 $35.000 percase per case per day percase case 00% 13% 50% 18% 13% Camm escal Payers Total Ravenue Net Revenues Annual Increse Salary Wage, Benefe Supplies, Drugs, Food Maragement Fees Opemting Expenses (fwed Operating Expenses (varieble) Land Lease (annual rae) 250 perFTE 7% ofnet@v $15,000000 Total Operating Expenses Net Prolit ounce: Crealed by case wwiter. EXHIBIT 2 Karen Mulroney's LTAC Hospital Financial Projections Number of Beds Year 1 Usization Year 2 Ubization Utization Incresse afer Year 2 Cornmental Player Commecial Payer Biling per Day Operating Variable Expense $2,800 70% Pabient Day Capacity 18 250 25018,250 18,250 18250 18.250 18.250 18250 18250 18250 80% 64% 68% 84% 88% 4745 10.950 11,0 RA10 13140 13.870 14.600 15.330 16.000 16.425 Pabent Days Used Average Patient Census per Dery Average Length ol Slay Number of Patients per Yor 514 3.5 541 3.5 1402.5 3.6 3.5 112 Full-Time Employoes INSURANCE PAYERS Mxing Rale 35% 29% 24% 9% 2% $27.795 $35,000 $2.800 $38.500 $35.000 percase per case per day percase case 00% 13% 50% 18% 13% Camm escal Payers Total Ravenue Net Revenues Annual Increse Salary Wage, Benefe Supplies, Drugs, Food Maragement Fees Opemting Expenses (fwed Operating Expenses (varieble) Land Lease (annual rae) 250 perFTE 7% ofnet@v $15,000000 Total Operating Expenses Net Prolit ounce: Crealed by case wwiterStep by Step Solution
There are 3 Steps involved in it
Step: 1

Get Instant Access to Expert-Tailored Solutions
See step-by-step solutions with expert insights and AI powered tools for academic success
Step: 2

Step: 3

Ace Your Homework with AI
Get the answers you need in no time with our AI-driven, step-by-step assistance
Get Started


