

Answered step by step
Verified Expert Solution
Question
1 Approved Answer
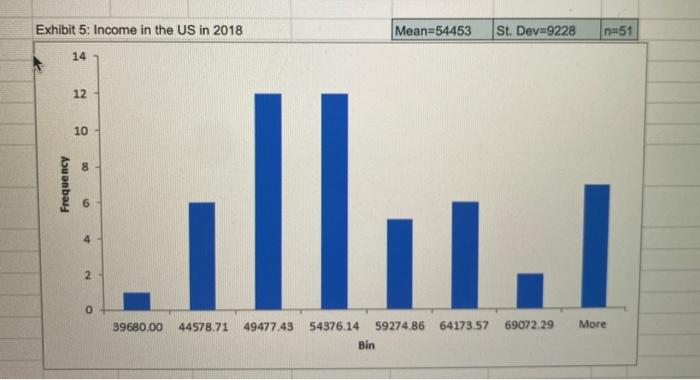
(Exhibit 5) What does Exhibit 5 represent? a side-by-side bar chart based on a pivot table a relative frequency tabular statistic the relationship between median
Step by Step Solution
There are 3 Steps involved in it
Step: 1

Get Instant Access to Expert-Tailored Solutions
See step-by-step solutions with expert insights and AI powered tools for academic success
Step: 2

Step: 3
Ace Your Homework with AI
Get the answers you need in no time with our AI-driven, step-by-step assistance
Get Started
Canadian Public Sector Financial Management
Authors: Andrew Graham
3rd Edition
1553395417, 9781553395416