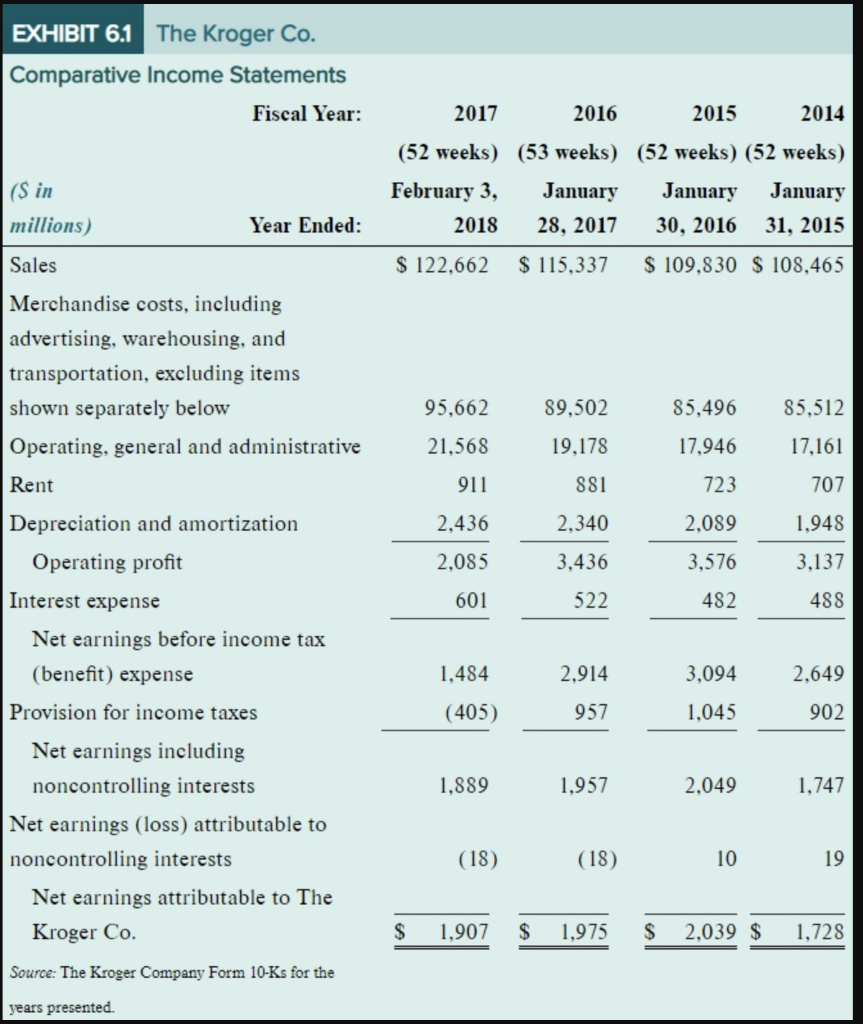
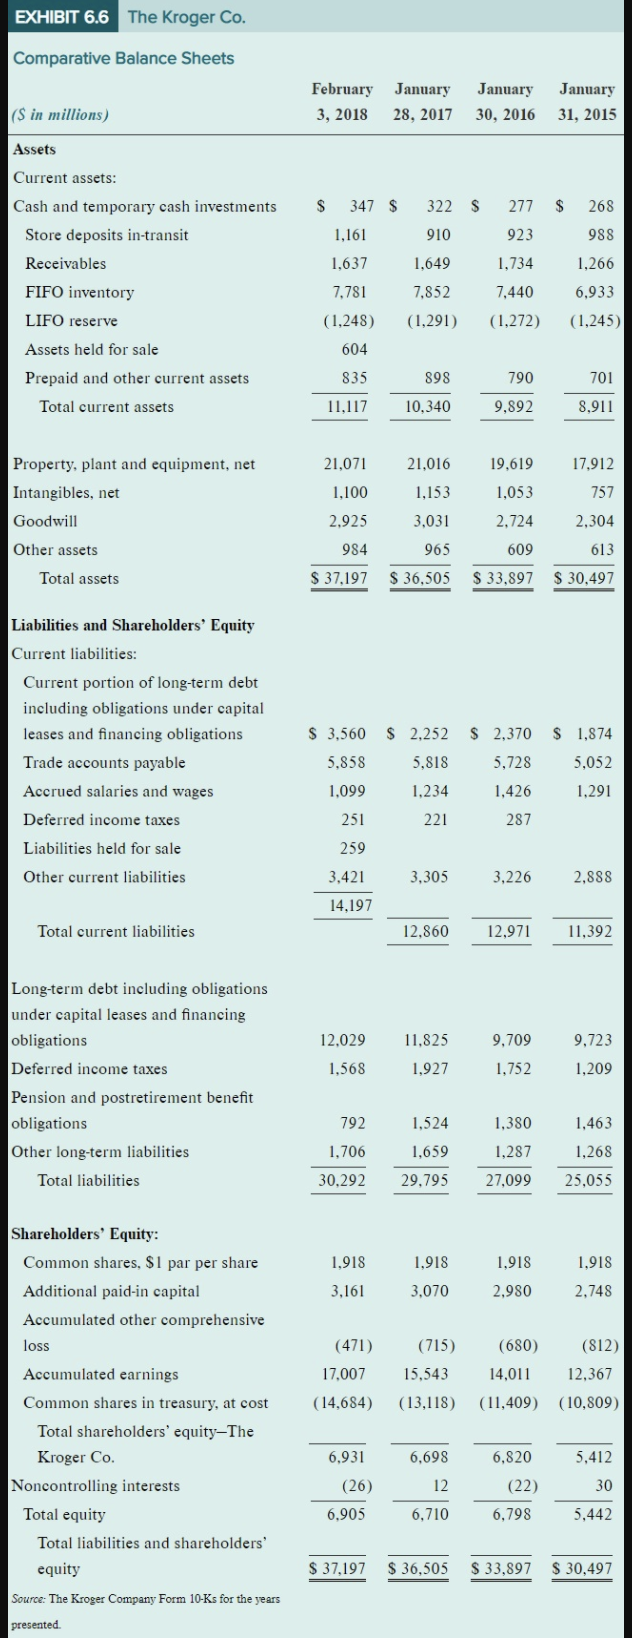
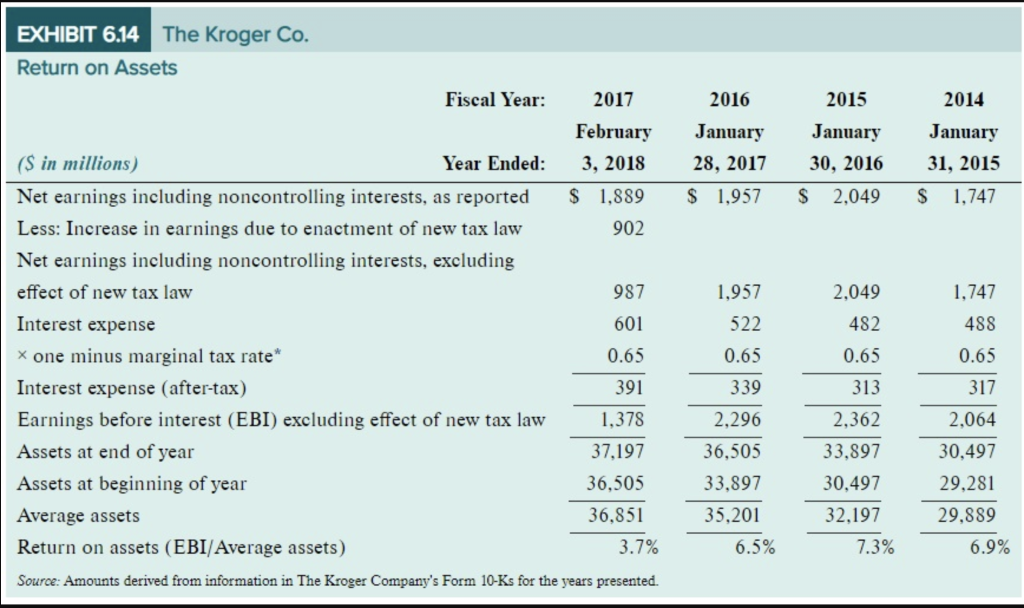
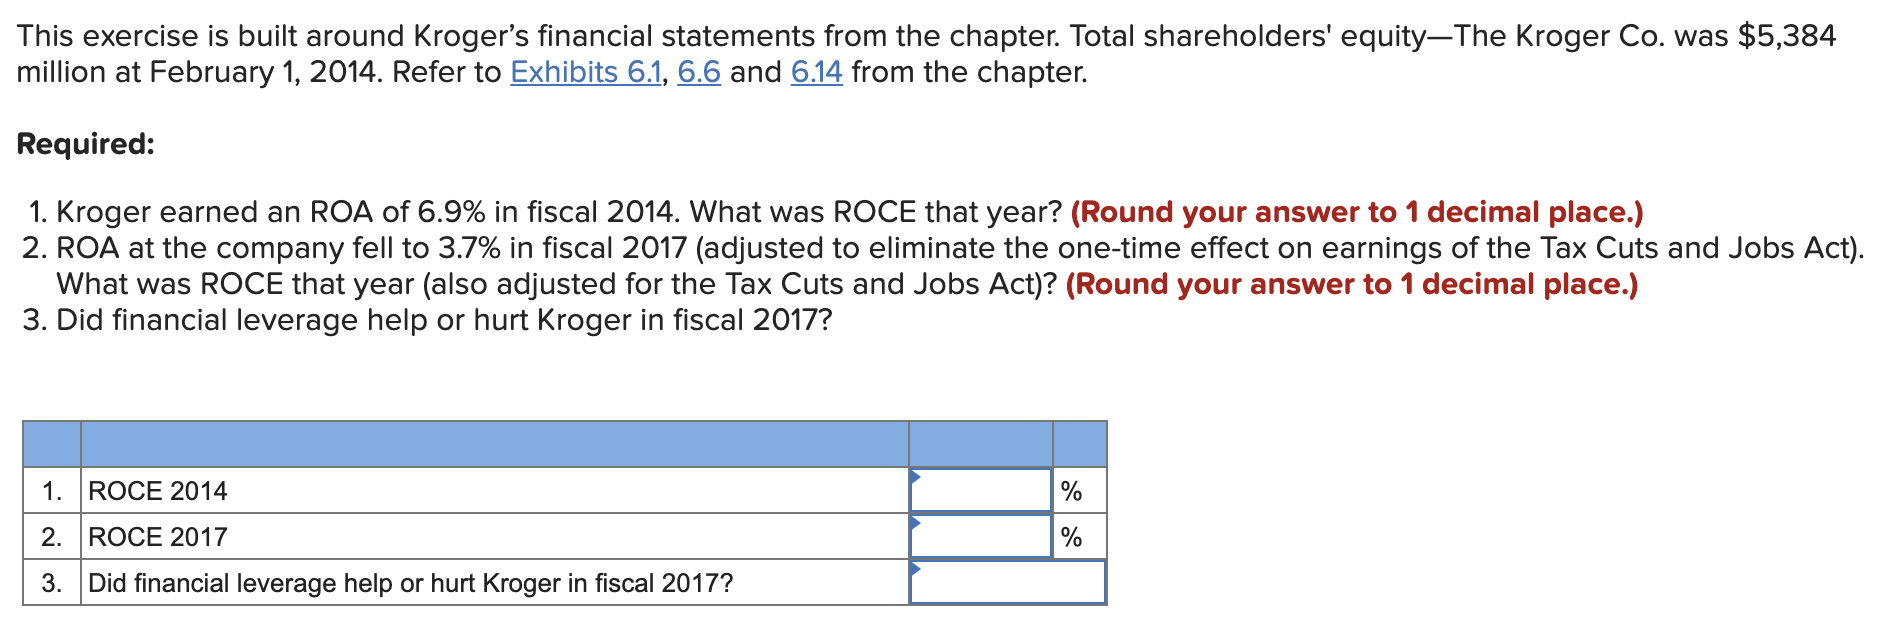
EXHIBIT 6.1 The Kroger Co. Comparative Income Statements Fiscal Year: 2017 2016 2015 2014 (52 weeks) (53 weeks) (52 weeks) (52 weeks) February 3, January January January 2018 28, 2017 30, 2016 31, 2015 $ 122,662 $ 115,337 $ 109,830 $ 108,465 95,662 89,502 85,496 85,512 21,568 19,178 17.946 17,161 911 881 723 707 2,436 2.340 2,089 1.948 (S in millions) Year Ended: Sales Merchandise costs, including advertising, warehousing, and transportation, excluding items shown separately below Operating, general and administrative Rent Depreciation and amortization Operating profit Interest expense Net earnings before income tax (benefit) expense Provision for income taxes Net earnings including noncontrolling interests Net earnings (loss) attributable to noncontrolling interests Net earnings attributable to The Kroger Co. 2,085 3,436 3,576 3,137 601 522 482 488 1,484 2,914 3,094 2,649 (405) 957 1.045 902 1.889 1,957 2,049 1,747 (18) (18) 10 19 $ 1,907 $ 1,975 $ 2,039 $ 1,728 Source: The Kroger Company Form 10-Ks for the years presented. EXHIBIT 6.6 The Kroger Co. Comparative Balance Sheets February 3, 2018 January 28, 2017 January 30, 2016 January 31, 2015 (S in millions) Assets Current assets: $ 347 $ 322 $ 277 $ 268 Cash and temporary cash investments Store deposits in-transit Receivables 1,161 910 923 988 1,637 1,649 1,734 1.266 7.781 7,852 7,440 6,933 FIFO inventory LIFO reserve (1,248) (1,291) (1,272) (1,245) Assets held for sale 604 Prepaid and other current assets 835 898 790 701 Total current assets 11.117 10,340 9,892 8,911 21.016 19,619 17,912 Property, plant and equipment, net Intangibles, net Goodwill 21,071 1,100 757 1,153 3,031 1,053 2,724 2.925 2,304 Other assets 984 965 609 613 Total assets $ 37,197 $ 36,505 $ 33,897 $ 30,497 Liabilities and Shareholders' Equity Current liabilities: Current portion of long-term debt including obligations under capital leases and financing obligations Trade accounts payable Accrued salaries and wages Deferred income taxes Liabilities held for sale $ 3,560 $ 2.252 $ 2,370 $ 1,874 5,728 5,052 5.858 5,818 1.099 1,234 1,426 1,291 251 221 287 259 Other current liabilities 3,421 3,305 3,226 2.888 14,197 Total current liabilities 12,860 12.971 11,392 12.860 12,971 11,392 12.029 11.825 9.709 1,752 9.723 1,209 1,568 1,927 Long-term debt including obligations under capital leases and financing obligations Deferred income taxes Pension and postretirement benefit obligations Other long-term liabilities Total liabilities 792 1,380 1,463 1,524 1,659 1,706 1,287 1,268 25.055 30.292 29,795 27.099 1,918 1,918 1,918 1,918 3.161 3,070 2,980 2,748 (471) (715) (680) (812) 17,007 14,011 Shareholders' Equity: Common shares, $1 par per share Additional paid-in capital Accumulated other comprehensive loss Accumulated earnings Common shares in treasury, at cost Total shareholders' equity-The Kroger Co. Noncontrolling interests Total equity Total liabilities and shareholders' equity 15,543 (13,118) 12,367 (10,809) (14,684) (11,409) 6,931 6,698 6.820 5,412 (26) 12 (22) 30 6.905 6,710 6,798 5,442 $ 37,197 $ 36,505 $ 33,897 $ 30,497 Source: The Kroger Company Form 10-Ks for the years presented. 2016 2015 2014 January 28, 2017 $ 1,957 January 30, 2016 $ 2,049 January 31, 2015 $ 1,747 1,957 2,049 1.747 EXHIBIT 6.14 The Kroger Co. Return on Assets Fiscal Year: 2017 February (s in millions) Year Ended: 3, 2018 Net earnings including noncontrolling interests, as reported $ 1,889 Less: Increase in earnings due to enactment of new tax law 902 Net earnings including noncontrolling interests, excluding effect of new tax law 987 Interest expense 601 x one minus marginal tax rate* 0.65 Interest expense (after-tax) 391 Earnings before interest (EBI) excluding effect of new tax law 1,378 Assets at end of year 37,197 Assets at beginning of year 36,505 Average assets 36,851 Return on assets (EBI/Average assets) 3.7% Source: Amounts derived from information in The Kroger Company's Form 10-Ks for the years presented. 522 482 488 0.65 0.65 0.65 339 313 317 2,362 2,296 36,505 33,897 33,897 30,497 32,197 7.3% 2,064 30,497 29,281 29.889 6.9% 35,201 6.5% This exercise is built around Kroger's financial statements from the chapter. Total shareholders' equity-The Kroger Co. was $5,384 million at February 1, 2014. Refer to Exhibits 6.1, 6.6 and 6.14 from the chapter. Required: 1. Kroger earned an ROA of 6.9% in fiscal 2014. What was ROCE that year? (Round your answer to 1 decimal place.) 2. ROA at the company fell to 3.7% in fiscal 2017 (adjusted to eliminate the one-time effect on earnings of the Tax Cuts and Jobs Act). What was ROCE that year (also adjusted for the Tax Cuts and Jobs Act)? (Round your answer to 1 decimal place.) 3. Did financial leverage help or hurt kroger in fiscal 2017? 1. ROCE 2014 % 2. ROCE 2017 % 3. Did financial leverage help or hurt Kroger in fiscal 2017? EXHIBIT 6.1 The Kroger Co. Comparative Income Statements Fiscal Year: 2017 2016 2015 2014 (52 weeks) (53 weeks) (52 weeks) (52 weeks) February 3, January January January 2018 28, 2017 30, 2016 31, 2015 $ 122,662 $ 115,337 $ 109,830 $ 108,465 95,662 89,502 85,496 85,512 21,568 19,178 17.946 17,161 911 881 723 707 2,436 2.340 2,089 1.948 (S in millions) Year Ended: Sales Merchandise costs, including advertising, warehousing, and transportation, excluding items shown separately below Operating, general and administrative Rent Depreciation and amortization Operating profit Interest expense Net earnings before income tax (benefit) expense Provision for income taxes Net earnings including noncontrolling interests Net earnings (loss) attributable to noncontrolling interests Net earnings attributable to The Kroger Co. 2,085 3,436 3,576 3,137 601 522 482 488 1,484 2,914 3,094 2,649 (405) 957 1.045 902 1.889 1,957 2,049 1,747 (18) (18) 10 19 $ 1,907 $ 1,975 $ 2,039 $ 1,728 Source: The Kroger Company Form 10-Ks for the years presented. EXHIBIT 6.6 The Kroger Co. Comparative Balance Sheets February 3, 2018 January 28, 2017 January 30, 2016 January 31, 2015 (S in millions) Assets Current assets: $ 347 $ 322 $ 277 $ 268 Cash and temporary cash investments Store deposits in-transit Receivables 1,161 910 923 988 1,637 1,649 1,734 1.266 7.781 7,852 7,440 6,933 FIFO inventory LIFO reserve (1,248) (1,291) (1,272) (1,245) Assets held for sale 604 Prepaid and other current assets 835 898 790 701 Total current assets 11.117 10,340 9,892 8,911 21.016 19,619 17,912 Property, plant and equipment, net Intangibles, net Goodwill 21,071 1,100 757 1,153 3,031 1,053 2,724 2.925 2,304 Other assets 984 965 609 613 Total assets $ 37,197 $ 36,505 $ 33,897 $ 30,497 Liabilities and Shareholders' Equity Current liabilities: Current portion of long-term debt including obligations under capital leases and financing obligations Trade accounts payable Accrued salaries and wages Deferred income taxes Liabilities held for sale $ 3,560 $ 2.252 $ 2,370 $ 1,874 5,728 5,052 5.858 5,818 1.099 1,234 1,426 1,291 251 221 287 259 Other current liabilities 3,421 3,305 3,226 2.888 14,197 Total current liabilities 12,860 12.971 11,392 12.860 12,971 11,392 12.029 11.825 9.709 1,752 9.723 1,209 1,568 1,927 Long-term debt including obligations under capital leases and financing obligations Deferred income taxes Pension and postretirement benefit obligations Other long-term liabilities Total liabilities 792 1,380 1,463 1,524 1,659 1,706 1,287 1,268 25.055 30.292 29,795 27.099 1,918 1,918 1,918 1,918 3.161 3,070 2,980 2,748 (471) (715) (680) (812) 17,007 14,011 Shareholders' Equity: Common shares, $1 par per share Additional paid-in capital Accumulated other comprehensive loss Accumulated earnings Common shares in treasury, at cost Total shareholders' equity-The Kroger Co. Noncontrolling interests Total equity Total liabilities and shareholders' equity 15,543 (13,118) 12,367 (10,809) (14,684) (11,409) 6,931 6,698 6.820 5,412 (26) 12 (22) 30 6.905 6,710 6,798 5,442 $ 37,197 $ 36,505 $ 33,897 $ 30,497 Source: The Kroger Company Form 10-Ks for the years presented. 2016 2015 2014 January 28, 2017 $ 1,957 January 30, 2016 $ 2,049 January 31, 2015 $ 1,747 1,957 2,049 1.747 EXHIBIT 6.14 The Kroger Co. Return on Assets Fiscal Year: 2017 February (s in millions) Year Ended: 3, 2018 Net earnings including noncontrolling interests, as reported $ 1,889 Less: Increase in earnings due to enactment of new tax law 902 Net earnings including noncontrolling interests, excluding effect of new tax law 987 Interest expense 601 x one minus marginal tax rate* 0.65 Interest expense (after-tax) 391 Earnings before interest (EBI) excluding effect of new tax law 1,378 Assets at end of year 37,197 Assets at beginning of year 36,505 Average assets 36,851 Return on assets (EBI/Average assets) 3.7% Source: Amounts derived from information in The Kroger Company's Form 10-Ks for the years presented. 522 482 488 0.65 0.65 0.65 339 313 317 2,362 2,296 36,505 33,897 33,897 30,497 32,197 7.3% 2,064 30,497 29,281 29.889 6.9% 35,201 6.5% This exercise is built around Kroger's financial statements from the chapter. Total shareholders' equity-The Kroger Co. was $5,384 million at February 1, 2014. Refer to Exhibits 6.1, 6.6 and 6.14 from the chapter. Required: 1. Kroger earned an ROA of 6.9% in fiscal 2014. What was ROCE that year? (Round your answer to 1 decimal place.) 2. ROA at the company fell to 3.7% in fiscal 2017 (adjusted to eliminate the one-time effect on earnings of the Tax Cuts and Jobs Act). What was ROCE that year (also adjusted for the Tax Cuts and Jobs Act)? (Round your answer to 1 decimal place.) 3. Did financial leverage help or hurt kroger in fiscal 2017? 1. ROCE 2014 % 2. ROCE 2017 % 3. Did financial leverage help or hurt Kroger in fiscal 2017