

Answered step by step
Verified Expert Solution
Question
1 Approved Answer
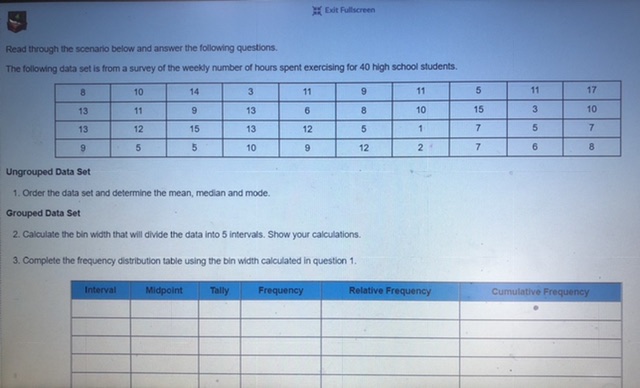
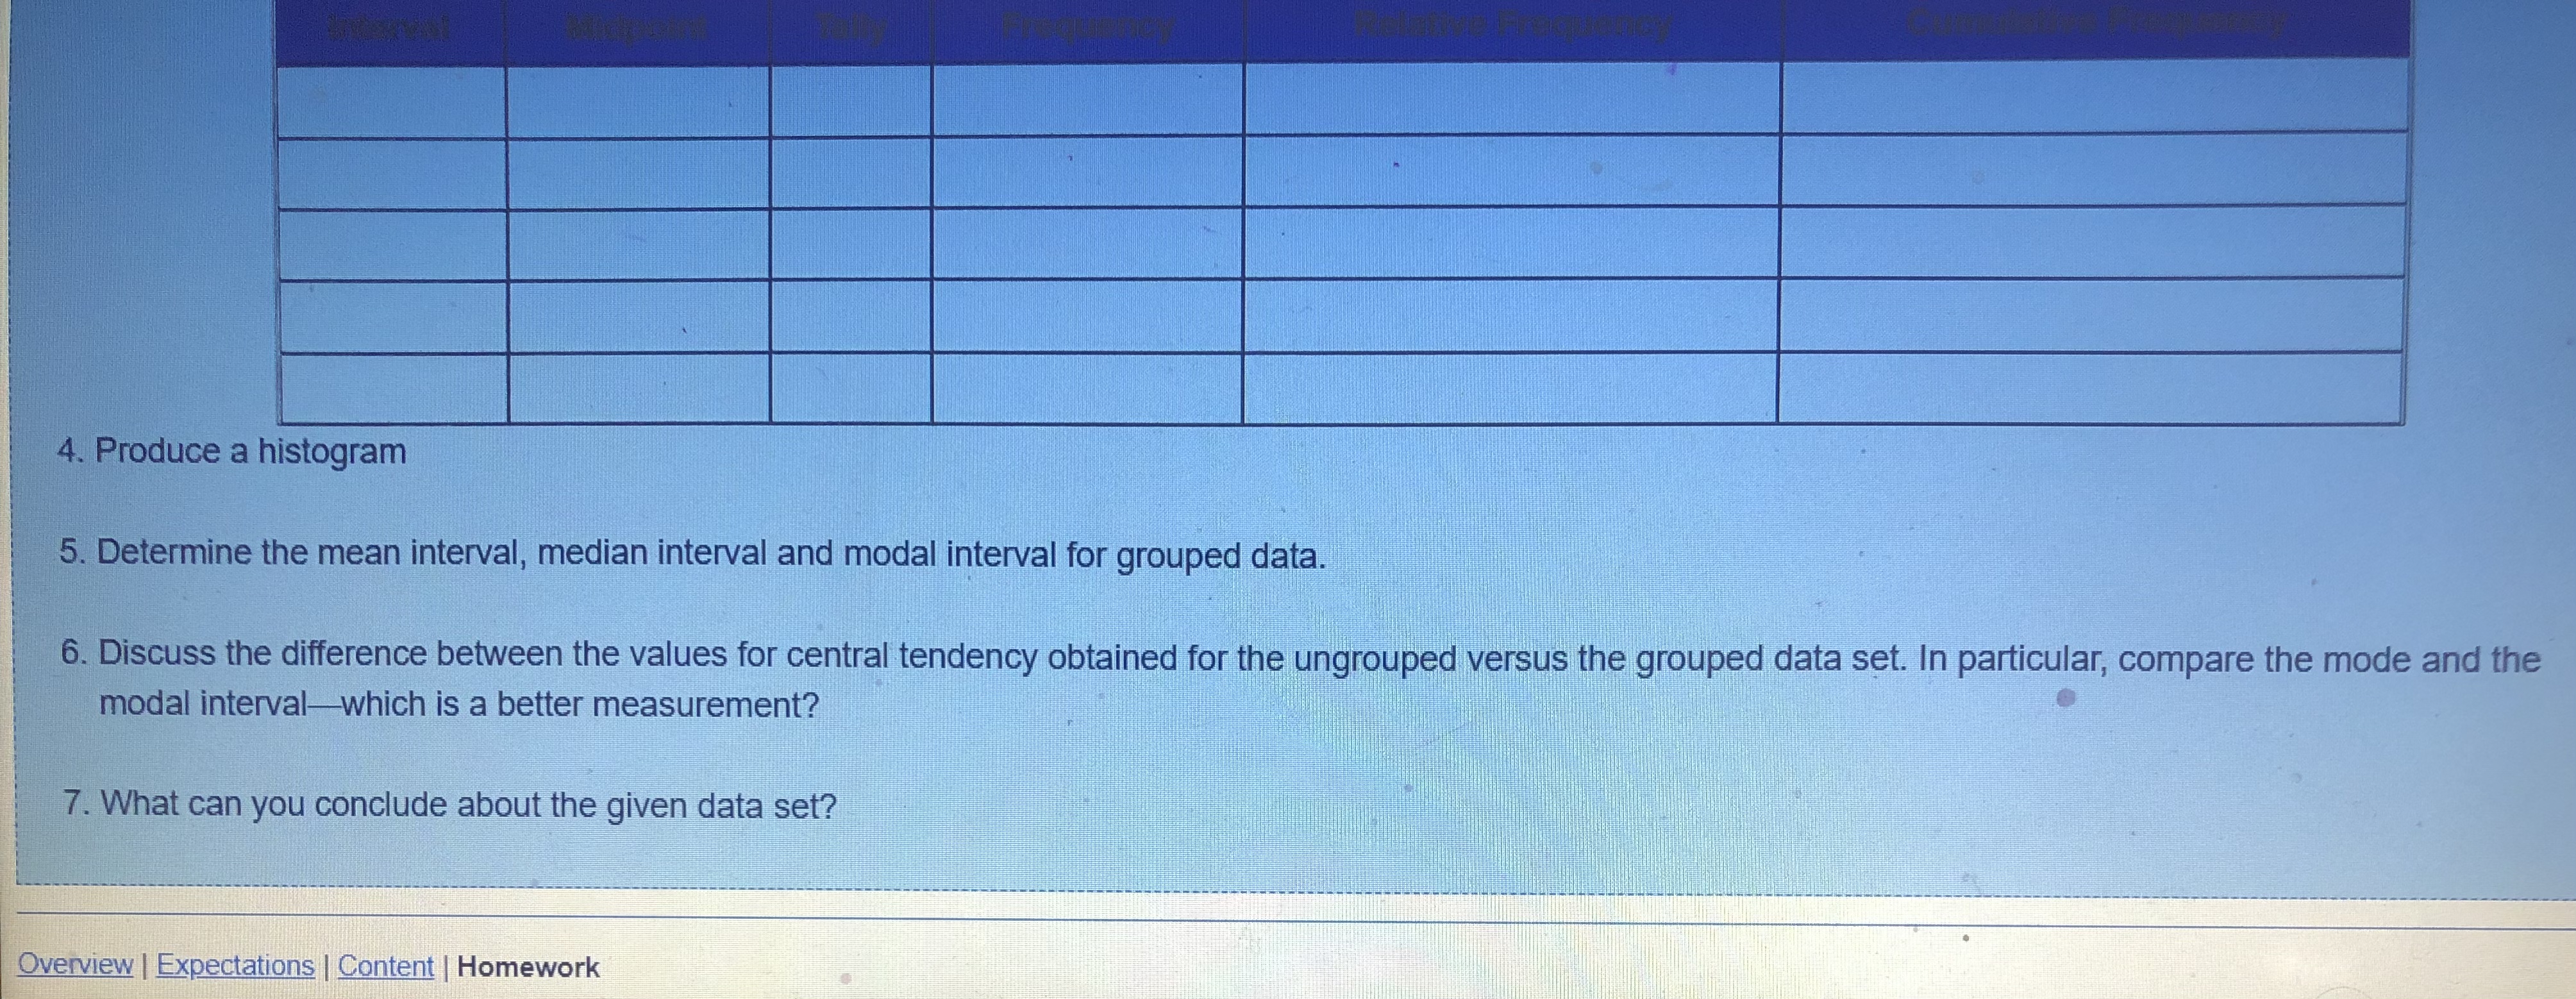
Exit Fullscreen Read through the scenario below and answer the following questions. The following data set is from a survey of the weekly number of
Step by Step Solution
There are 3 Steps involved in it
Step: 1

Get Instant Access to Expert-Tailored Solutions
See step-by-step solutions with expert insights and AI powered tools for academic success
Step: 2

Step: 3
Ace Your Homework with AI
Get the answers you need in no time with our AI-driven, step-by-step assistance
Get Started
Finite Mathematics
Authors: Stefan Waner, Jerry Lee Ford Jr, Waner/Costenoble, Steven Costenoble
5th Edition