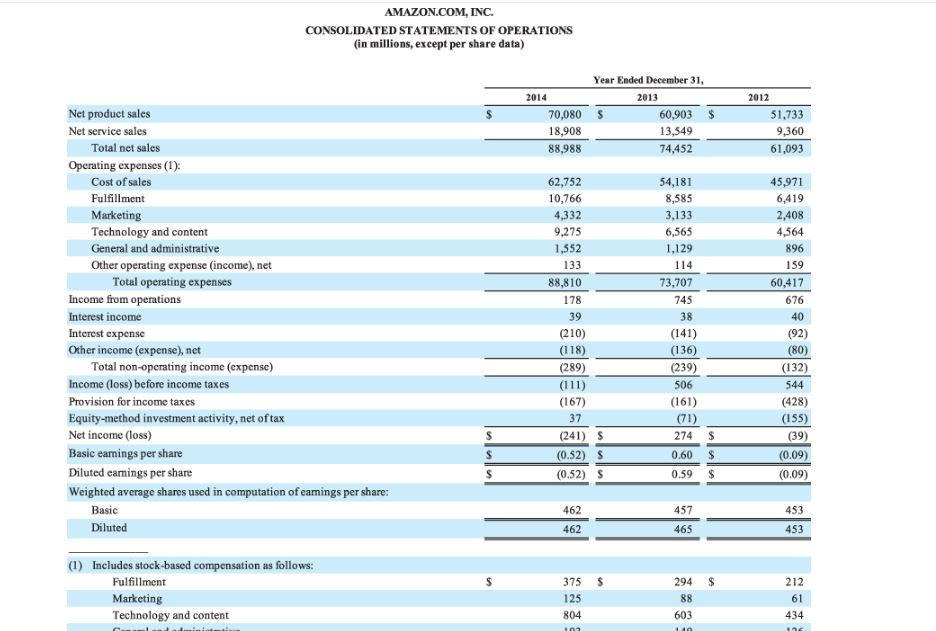
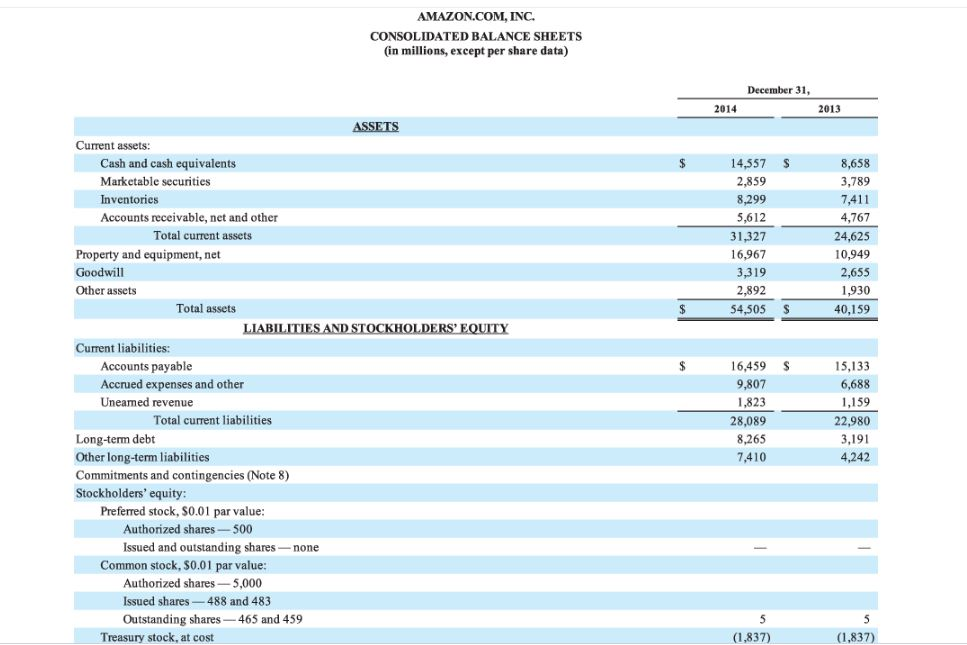
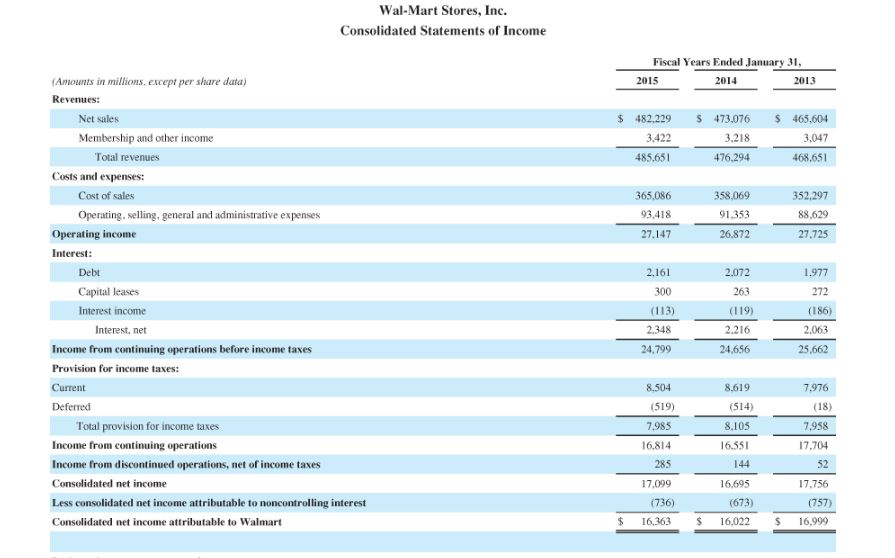
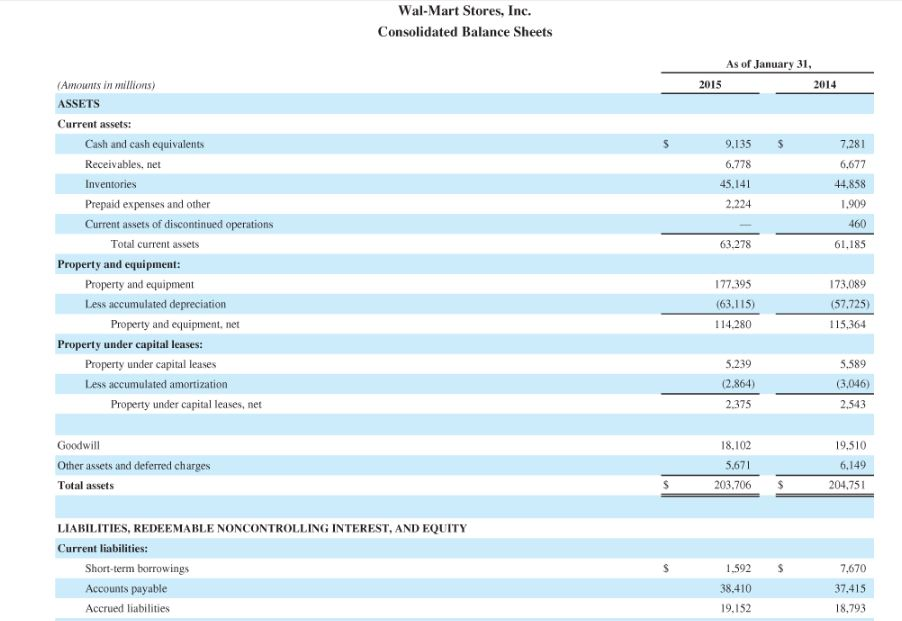
Expand Your Critical Thinking 6-3 Your answer is incorrect. Try again. The financial statements of Amazon.com, Inc. are presented in Appendix D. Click here to view Appendix D, Financial statements for Wal-Mart Stores, Inc. are presented in Appendix E Click here to view Appendix E. Based on the information in the financial statements, compute these 2014 values for Amazon.com, Inc. and 2015 values for Wal-Mart Stores, Inc.(Round answers to 1 decimal place, e.g. 15.2.) (1) Inventory turnover. (Use cost of sales and inventories) (2) Days in inventory Amazon.com Wal-mart Inventory turnover ratio 52.6 times 297 times Days in inventory 6.9 days days AMAZON.COM, INC. CONSOLIDATED SATE MENTS OF OPERATIONS (in millions, except per share data) Year Ended December 31 2014 2013 2012 Net product sales Net service sales 70,080S 60,903 $ 18,908 88,988 13,549 74,452 51,733 9,360 61,093 Total net sales Operating expenses (1) Cost of sales Fulfillment Marketing Technology and content General and administrative Other operating expense (income), net 62,752 10,766 4,332 9,275 1,552 133 88,810 178 39 (210) 54,181 8,585 3,133 6,565 1,129 114 73,707 745 45,971 6,419 2,408 4,564 896 159 60,417 676 40 (92) (80) (132) 544 (428) (155) (39) (0.09) (0.09) Total operating expenses Income from operations Interest income Interest expense Other income (expense), net (136) (239) Total non-operating income (expensc) (289) Income (loss) before income taxes Provision for income taxes Eq (161) uity-method investment activity, net of tax Net income (loss) Basic eanings per share Diluted eamings per share Weighted average shares used in computation of eamings per share: 37 (241) S (0.52) S (0.52) S (71) 274 S 0.60 $ 0.59 $ Basic 462 462 457 453 Diluted 465 453 (1) Includes stock-based compensation as follows: 375 S 125 804 294 S Fulfillment Marketing Technology and content 61 603 AMAZON.COM, INC. CONSOLIDATED BALANCE SHEETS (in millions, except per share data) December 31 2014 2013 ASSETS Current assets: 14,557 $ 8,658 3,789 7,411 4,767 24,625 10,949 2,655 1,930 40,159 Cash and cash equivalents Marketable securities Inventories Accounts receivable, net and other 2,859 8,299 5,612 Total current assets Property and equipment, net Goodwill Other assets 16,967 3,319 Total assets 54,505 S Current liabilities: Accounts payable Accrued expenses and other Uneamed revenue 16,459 S 9,807 1,823 15,133 6,688 1,159 22,980 3,191 4,242 Total current liabilities 28,089 8,265 7,410 Long-term debt Other long-term liabilities Commitments and contingencies (Note 8) Stockholders' equity: Preferred stock, $0.01 par value Authorized shares-500 Issued and outstanding shares-none Common stock, S0.01 par value Authorized shares 5,000 Issued shares-488 and 483 Outstanding shares465 and 459 Treasury stock, at cost (1,837) (1,837) Wal-Mart Stores, Inc. Consolidated Statements of Income Fiscal Years Ended January 31 Amounts in millions, except per share data) Revenues: 2015 2014 2013 Net sales $ 482,229 3.422 485.651 473,076 465,604 3,047 468,651 Membership and other income 3.218 Total revenues 476.294 Costs and expenses: Cost of sales 365,086 93.418 27,147 358,069 91.353 26,872 352.297 88,629 27.725 Operating, selling, general and administrative expenses Operating income Interest: Debt Capital leases Interest income 2.161 300 (113) 2.348 24,799 2.072 263 (119) 2.216 24,656 1.977 272 (186) 2.063 25,662 Interest, net Income from continuing operations before income taxes Provision for income taxes: Current Deferred 7.976 8.619 (514) 8.105 16.551 144 16,695 (673) 8.504 (519) 7,983 16.814 285 17,099 736) (18) 7.958 17.704 52 17,756 (757) Total provision for income taxes Income from continuing operations Income from discontinued operations, net of income taxes Consolidated net income Less consolidated net income attributable to noncontrolling interest Consolidated net income attributable to Walmart $ 16.363 16.022 6,999 Wal-Mart Stores, Inc. Consolidated Balance Sheets As of January 31 2015 (Amonts in illions) ASSETS Current assets: 2014 Cash and cash equivalents Receivables, net Inventories Prepaid expenses and other Current assets of discontinued operations 9.135 $ 6.778 45.141 2.224 7.281 6,677 44.858 1,909 460 61,185 Total current assets 63.278 Property and equipment: Property and equipment Less accumulated depreciation 177.395 (63.115) 114.280 173,089 (57.725) 115,364 Property and equipment, net Property under capital leases: Property under capital leases Less accumulated amortization 5.239 (2,864) 2.375 5,589 3,046) 2,543 Property under capital leases, net Goodwill Other assets and deferred charges Total assets 19.510 6,149 204,751 18.102 5.671 203.706$ LIABILITIES, REDEEMABLE NONCONTROLLING INTEREST, AND EQUITY Current liabilities: Short-term borrowings Accounts payable Accrued liabilities 1,592 38.410 19.152 7,670 37.415 18,793


