

Question: Expected Output Instructions: Write an OOP program to calculate the average category, pressure, and wind speed of Atlantic hurricanes that have occurred between a given
Expected Output
Instructions: Write an OOP program to calculate the average category, pressure, and wind speed of Atlantic hurricanes that have occurred between a given year range. Also, tally the number of storms in each category according to the Saffir-Simpson scale.
- Create a new project folder called Challenge Program in the Mod07 Assignments folder.
- Download the HurricaneTester.java as starter code for your project.
- Download the Hurricane.java object class and the HurricaneData.txt file to the new project.
- Examine the text file to become familiar with the information it contains. The name, pressure (mb), wind speed (kts), month, and year have been provided.
- Write your tester class. Document each section of code. Use for-each loops and traditional for loops where they are appropriate.
- Review the code in the starter program that reads all the data from the text file and stores it in arrays.
- Convert the wind speed from knots to miles per hour.
- The category of each storm is not provided. Use the Saphir-Simpson Wind Speed Scale to determine the category of each storm and assign to an array.
- Using the newly assigned arrays, create an ArrayList of Hurricane objects.
- Ask the user to provide a range of years. Use this range to create the output. Ensure the user picked years for which you have data.
- For the given year range, calculate the average for category, wind speed, and pressure.
- Use the Integer.MIN_VALUE and Integer.MAX_VALUE constants. Do not use Java's max() or min() methods.
- Print the results in a well formatted, user-friendly fashion. Complete the toString() method in the Hurricane object class. String data should be left justified. Numeric data needs to be aligned on the decimal point. Use the sample below as a guide.
Saphir-Simpson Hurricane Wind Scale: Scale used to categorize hurricanes.
| Wind Speed | Category |
|---|---|
| 7495 mph | 1 |
| 96110 mph | 2 |
| 111129 mph | 3 |
| 130156 mph | 4 |
| 157 mph or higher | 5 |
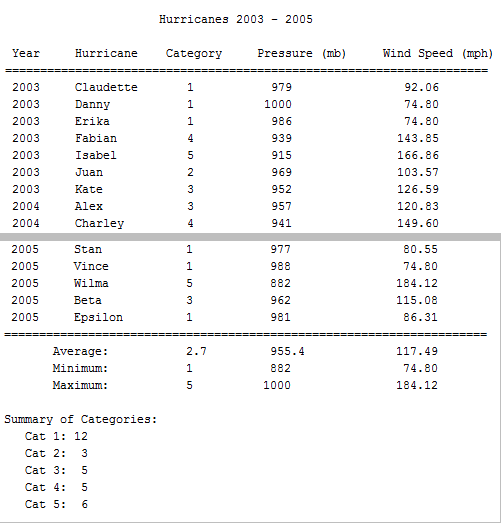
Expected Output: Your program's output should be similar to the following screen shot. Due to the amount of information, only the top and bottom of the output generated is shown in this image.
STARTER CODE - TESTER
/** * Starter code for the Hurricane Tester * APCS Team 2020 * */ import java.io.IOException; import java.io.PrintWriter; import java.io.File; import java.util.Scanner; public class HurricaneTester
{
public static void main(String[] args) throws IOException { //read data from text file & put in an array File fileName = new File("hurricanedata.txt"); Scanner inFile = new Scanner(fileName); int numValues = 0; //count number of lines in text file while (inFile.hasNextLine() ) { inFile.nextLine(); numValues++; } inFile.close(); //initialize arrays based on lines counted in text file int [] years = new int[numValues]; String [] months = new String[numValues]; int [] pressures = new int[numValues]; double [] windSpeeds = new double[numValues]; String [] names = new String[numValues]; //read and assign data from text file to the arrays inFile = new Scanner(fileName); int index = 0; while(inFile.hasNext() ) { years[index] = inFile.nextInt(); months[index] = inFile.next(); pressures[index] = inFile.nextInt(); windSpeeds[index] = inFile.nextDouble(); names[index] = inFile.next(); index++; } inFile.close(); //convert the windspeed, determine categories, calculate sums //create a Hurricane ArrayList using the data above //user prompted for range of years //print the data } }
STARTER CODE
/** * @purpose: Hurricane Object Class * * @author APCS Team * @version FLVS 2020 * */ public class Hurricane { private String name, month; private int year; private int cat; private int pressure; private double windspeed;
//constructor - all private instance variables initialized public Hurricane(int y, String n, String m, int c, int p, double w) { this.year = y; this.name = n; this.month = m; this.cat = c; this.pressure = p; this.windspeed = w; }
//accessor for year public int getYear() { return year; }
//accessor for name public String getName() { return name; } //accessor for month public String getMonth() { return month; } //accessor for category public int getCat() { return cat; } //accessor for pressure public int getPressure() { return pressure; } //accessor for windspeed public double getWindspeed() { return windspeed; } //mutator for year public void setYear(int y) { year = y; } //mutator for name
public void setName(String n) { name = n; } //mutator for month public void setMonth(String m) { month = m; } //mutator for category public void setCat(int c) { cat = c; } //mutator for pressure public void setPressure(int p) { pressure = p; } //mutator for windspeed public void setWindspeed (double w) { windspeed = w; }
public String toString() { // complete the toString method using String.format() } }
HURRICANE DATA
1995 Jun 987 65 Allison 1995 Jul 973 85 Erin 1995 Aug 929 120 Felix
Hurricanes 2003 - 2005 Year Hurricane Category Pressure (mb) Wind Speed (mph) 979 2003 2003 2003 2003 2003 2003 2003 2004 2004 Claudette Danny Erika Fabian Isabel Juan Kate Alex Charley 1 1 1 4 5 2 3 3 1000 986 939 915 969 952 957 941 92.06 74.80 74.80 143.85 166.86 103.57 126.59 120.83 149.60 4 2005 2005 2005 2005 2005 Stan Vince Wilma Beta Epsilon 1 1 5 977 988 882 962 981 80.55 74.80 184.12 115.08 86.31 3 1 Average: Minimum: Maximum: 2.7 1 955.4 882 1000 117.49 74.80 184.12 5 Summary of Categories: Cat 1 : 12 Cat 2: 3 Cat 3: 5 Cat 4: 5 Cat 5: 6 Hurricanes 2003 - 2005 Year Hurricane Category Pressure (mb) Wind Speed (mph) 979 2003 2003 2003 2003 2003 2003 2003 2004 2004 Claudette Danny Erika Fabian Isabel Juan Kate Alex Charley 1 1 1 4 5 2 3 3 1000 986 939 915 969 952 957 941 92.06 74.80 74.80 143.85 166.86 103.57 126.59 120.83 149.60 4 2005 2005 2005 2005 2005 Stan Vince Wilma Beta Epsilon 1 1 5 977 988 882 962 981 80.55 74.80 184.12 115.08 86.31 3 1 Average: Minimum: Maximum: 2.7 1 955.4 882 1000 117.49 74.80 184.12 5 Summary of Categories: Cat 1 : 12 Cat 2: 3 Cat 3: 5 Cat 4: 5 Cat 5: 6
Step by Step Solution
There are 3 Steps involved in it

Get step-by-step solutions from verified subject matter experts