

Answered step by step
Verified Expert Solution
Question
1 Approved Answer
expected proportion of zeros would be p=0.1. Null and Alternative Hypotheses: H0:p=0.1(expectedproportion)H0;pRandomization Hypothesis Test- Test for Single Proportion - From the Dropdown Menu, select Random
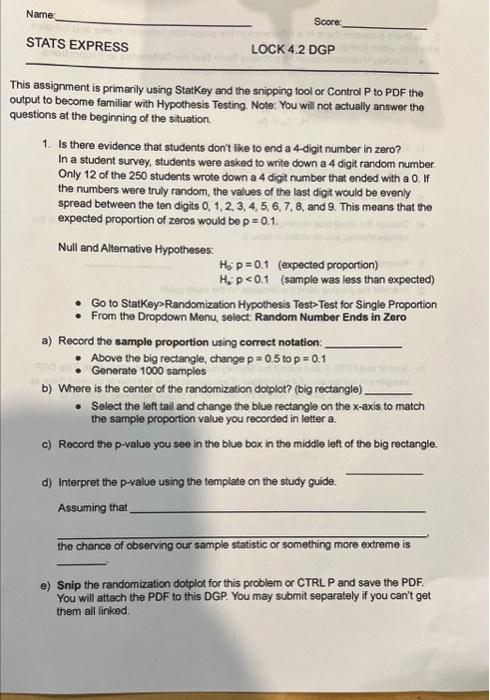
 expected proportion of zeros would be p=0.1. Null and Alternative Hypotheses: H0:p=0.1(expectedproportion)H0;pRandomization Hypothesis Test- Test for Single Proportion - From the Dropdown Menu, select Random Number Ends in Zero a) Record the sample proportion using correct notation: - Above the big rectangle, change p=0.5 to p=0.1 - Generate 1000 samples b) Where is the center of the randomization dotplot? (big rectangle) - Select the left tail and change the blue rectangle on the x-axis to match the sample proportion value you recorded in letter a. c) Record the p-value you see in the blue box in the middle left of the big rectangle. d) Interpret the p-value using the template on the study guide. Assuming that the chance of observing our sample statistic or something more extreme is e) Snip the randomization dotplot for this problem or CTRL P and save the PDF. You will attach the PDF to this DGP. You may submit separately if you can't get them all linked. Thin assigment is primarly usire suekey and the snipping tool or Control P is POF the output to became tanelier with Hepothesin Teating Note You will not actually answer the quetions at the begming of the stuation 1. Is the evidence that studens dont lae so end a 4 -digt number in zero? In a studert survey, studerts were ablad to wite down a 4 digh rindom number. Only 12 of the 250 students wrole doen a 4 dot number that ended with a Q if the numbect wore they randoen the values of the last digt would be evenly apread between the ten digits 0,1,2,3,4,5,6,7,8, and 9 . This mears that the expected proporion of zeres would be p=0. . Null and Alternative Hypothetex: H,p=Q:1 (expectied proportion) H,pRandomization Hypothesis Test- Test for Single Proportion - From the Dropdown Menu, select Random Number Ends in Zero a) Record the sample proportion using correct notation: - Above the big rectangle, change p=0.5 to p=0.1 - Generate 1000 samples b) Where is the center of the randomization dotplot? (big rectangle) - Select the left tail and change the blue rectangle on the x-axis to match the sample proportion value you recorded in letter a. c) Record the p-value you see in the blue box in the middle left of the big rectangle. d) Interpret the p-value using the template on the study guide. Assuming that the chance of observing our sample statistic or something more extreme is e) Snip the randomization dotplot for this problem or CTRL P and save the PDF. You will attach the PDF to this DGP. You may submit separately if you can't get them all linked. Thin assigment is primarly usire suekey and the snipping tool or Control P is POF the output to became tanelier with Hepothesin Teating Note You will not actually answer the quetions at the begming of the stuation 1. Is the evidence that studens dont lae so end a 4 -digt number in zero? In a studert survey, studerts were ablad to wite down a 4 digh rindom number. Only 12 of the 250 students wrole doen a 4 dot number that ended with a Q if the numbect wore they randoen the values of the last digt would be evenly apread between the ten digits 0,1,2,3,4,5,6,7,8, and 9 . This mears that the expected proporion of zeres would be p=0. . Null and Alternative Hypothetex: H,p=Q:1 (expectied proportion) H,p
Step by Step Solution
There are 3 Steps involved in it
Step: 1

Get Instant Access with AI-Powered Solutions
See step-by-step solutions with expert insights and AI powered tools for academic success
Step: 2

Step: 3
Ace Your Homework with AI
Get the answers you need in no time with our AI-driven, step-by-step assistance
Get Started