Answered step by step
Verified Expert Solution
Link Copied!

Question

1 Approved Answer

(Expected return, standard deviation, and capital asset pricing model) The following are the end-of-month prices for both the Standard & Poor's 500 Index and Nike's
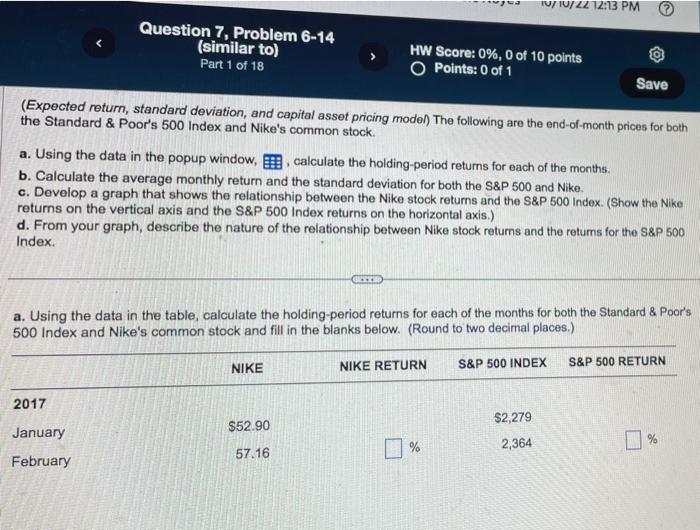
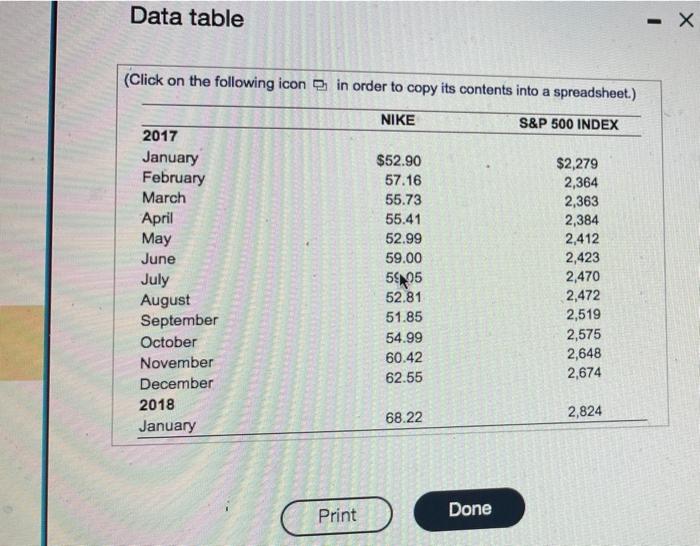
image text in transcribed
(Expected return, standard deviation, and capital asset pricing model) The following are the end-of-month prices for both the Standard \& Poor's 500 Index and Nike's common stock. a. Using the data in the popup window, , calculate the holding-period returns for each of the months. b. Calculate the average monthly return and the standard deviation for both the S\&P 500 and Nike. c. Dovelop a graph that shows the relationship between the Nike stock returns and the S\&P 500 Index. (Show the Nike returns on the vertical axis and the S\&P 500 Index returns on the horizontal axis.) d. From your graph, describe the nature of the relationship between Nike stock returns and the retums for the S\&P 500 Index. a. Using the data in the table, calculate the holding-period returns for each of the months for both the Standard \& Poor's 500 Index and Nike's common stock and fill in the blanks below. (Round to two decimal places.) Data table (Click on the following icon in order to copy its contents into a spreadsheet.)

Step by Step Solution

There are 3 Steps involved in it

Step: 1

blur-text-image

Get Instant Access to Expert-Tailored Solutions

See step-by-step solutions with expert insights and AI powered tools for academic success

Step: 2

blur-text-image_2

Step: 3

blur-text-image_3

Ace Your Homework with AI

Get the answers you need in no time with our AI-driven, step-by-step assistance

Get Started

Recommended Textbook for

Finance And Security Global Vulnerabilities Threats And Responses

Authors: Martin S. Navias

1st Edition

1787381366, 978-1787381360

More Books

Students also viewed these Finance questions