

Question: Expected return, Wandard deviation, and capital asset pricing mode The following are the end of month prices for both the Standard & Poor's 500 Index

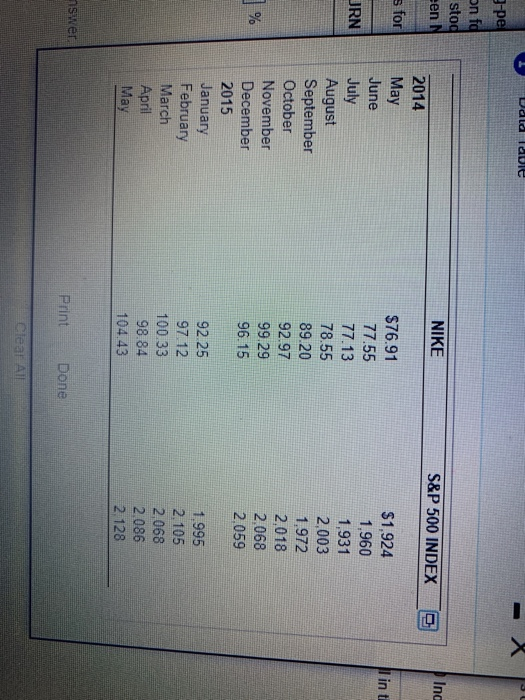
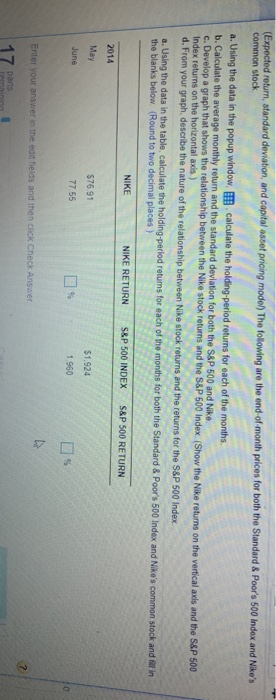
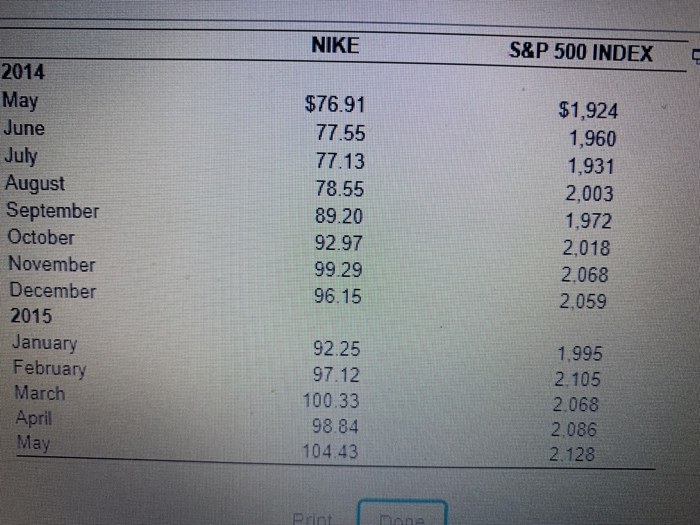
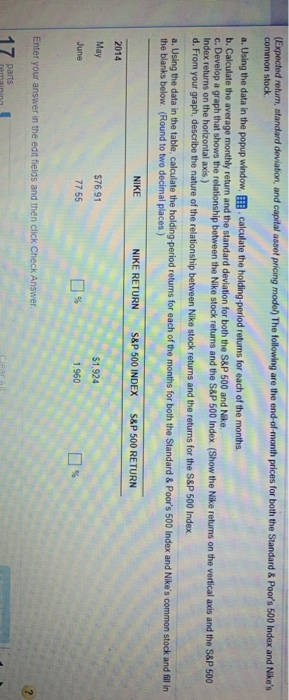
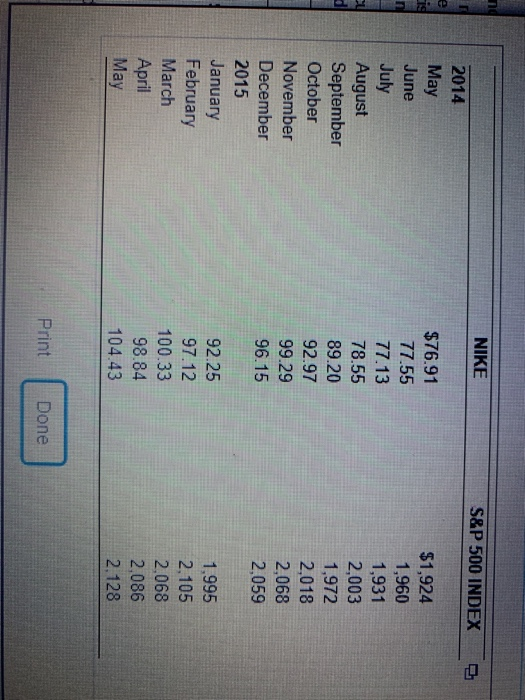
Expected return, Wandard deviation, and capital asset pricing mode The following are the end of month prices for both the Standard & Poor's 500 Index and Nike's common stock Using the data in the popup window, calculate the holing period returns for each of the months b. Cacate the average monthly burn and the Mandard deviation for both the S&P 500 and c. Develop a graph that shows the relationship between the Nike shock returns and the S&P 500 index (Show the returns on the verticals d. From your graphische enre of the relationship between Nike shock returns and the returns for the S&P 500 index and the S&P 500 index returns on the horizontal ) Using the data in the table calcate the holong period rams for each of the month for both the Standard & Poor's 500 index and Roscommon stock and in the banks below Round decimal places) NIKE RETURN SAP 500 INDEX SAP 500 RETURN 576.51 7755 51.924 Enter your answer in the cold and then chok CheckAnswer 17 Data Table 3-pe on fa stog een N NIKE S&P 500 INDEX 2014 fr May in ti June JRN July $76.91 77.55 77.13 78.55 89.20 92.97 $1,924 1,960 1,931 2,003 1.972 2,018 2.068 2,059 August September October November December 2015 January February March April 99.29 96.15 92 25 9712 100.33 98.84 104.43 1.995 2.105 2.068 2 086 2.128 May nser Print Done (Expected return, standard deviation, and capital asset pricing model) The following are the end-of-month prices for both the Standard & Poor's 500 index and Nike's common stock a. Using the data in the popup window, calculate the holding period returns for each of the months b. Calculate the average monthly return and the standard deviation for both the S&P 500 and Nike c. Develop a graph that shows the relationship between the Nike stock returns and the S&P 500 Index (Show the Nike returns on the vertical axis and the S&P 500 Index returns on the horizontal axis) d. From your graph, describe the nature of the relationship between Nike stock returns and the returns for the S&P 500 Index a. Using the data in the table, calculate the holding period returns for each of the months for both the Standard & Poor's 500 Index and Nike's common stock and Morin the blanks below. (Round to two decimal places ) NIKE NIKE RETURN S&P 500 INDEX S&P 500 RETURN 2014 May $76.91 June 77.55 $1.924 1.960 % LS Enter your answer in the edit fields and then click Check Answer 17 Peman NIKE S&P 500 INDEX 2014 May June July August September October November December 2015 January February March April May $76.91 77.55 77.13 78.55 89.20 92.97 99.29 96.15 $1,924 1,960 1,931 2,003 1,972 2,018 2.068 2.059 92.25 97.12 100.33 98.84 104.43 1,995 2.105 2.068 2.086 2.128 (Expected return, standard deviation, and capital asset pricing model) The following are the end-of-month prices for both the Standard & Poor's 500 Index and Nike's common stock a. Using the data in the popup Window, calculate the holding period returns for each of the months b. Calculate the average monthly return and the standard deviation for both the S&P 500 and Nike c. Develop a graph that shows the relationship between the Nike stock returns and the S&P 500 Index (Show the Nike returns on the vertical axis and the S&P 500 Index returns on the horizontal axis.) d. From your graph, describe the nature of the relationship between Nike stock returns and the returns for the S&P 500 Index a. Using the data in the table, calculate the holding period returns for each of the months for both the Standard & Poor's 500 Index and Nike's common stock and fill in the blanks below. (Round to two decimal places) NIKE NIKE RETURN S&P 500 INDEX S&P 500 RETURN 2014 May $76.91 $1.924 June 77.55 % Enter your answer in the edit fields and then click Check Answer 17 parts PA NIKE S&P 500 INDEX E 2014 May June July August September October November December 2015 January February March April May $76.91 77.55 77.13 78.55 89.20 92.97 99.29 96.15 $1,924 1,960 1,931 2,003 1,972 2,018 2,068 2,059 92.25 97.12 100.33 98.84 104.43 1,995 2.105 2,068 2,086 2.128 Print Done Expected return, Wandard deviation, and capital asset pricing mode The following are the end of month prices for both the Standard & Poor's 500 Index and Nike's common stock Using the data in the popup window, calculate the holing period returns for each of the months b. Cacate the average monthly burn and the Mandard deviation for both the S&P 500 and c. Develop a graph that shows the relationship between the Nike shock returns and the S&P 500 index (Show the returns on the verticals d. From your graphische enre of the relationship between Nike shock returns and the returns for the S&P 500 index and the S&P 500 index returns on the horizontal ) Using the data in the table calcate the holong period rams for each of the month for both the Standard & Poor's 500 index and Roscommon stock and in the banks below Round decimal places) NIKE RETURN SAP 500 INDEX SAP 500 RETURN 576.51 7755 51.924 Enter your answer in the cold and then chok CheckAnswer 17 Data Table 3-pe on fa stog een N NIKE S&P 500 INDEX 2014 fr May in ti June JRN July $76.91 77.55 77.13 78.55 89.20 92.97 $1,924 1,960 1,931 2,003 1.972 2,018 2.068 2,059 August September October November December 2015 January February March April 99.29 96.15 92 25 9712 100.33 98.84 104.43 1.995 2.105 2.068 2 086 2.128 May nser Print Done (Expected return, standard deviation, and capital asset pricing model) The following are the end-of-month prices for both the Standard & Poor's 500 index and Nike's common stock a. Using the data in the popup window, calculate the holding period returns for each of the months b. Calculate the average monthly return and the standard deviation for both the S&P 500 and Nike c. Develop a graph that shows the relationship between the Nike stock returns and the S&P 500 Index (Show the Nike returns on the vertical axis and the S&P 500 Index returns on the horizontal axis) d. From your graph, describe the nature of the relationship between Nike stock returns and the returns for the S&P 500 Index a. Using the data in the table, calculate the holding period returns for each of the months for both the Standard & Poor's 500 Index and Nike's common stock and Morin the blanks below. (Round to two decimal places ) NIKE NIKE RETURN S&P 500 INDEX S&P 500 RETURN 2014 May $76.91 June 77.55 $1.924 1.960 % LS Enter your answer in the edit fields and then click Check Answer 17 Peman NIKE S&P 500 INDEX 2014 May June July August September October November December 2015 January February March April May $76.91 77.55 77.13 78.55 89.20 92.97 99.29 96.15 $1,924 1,960 1,931 2,003 1,972 2,018 2.068 2.059 92.25 97.12 100.33 98.84 104.43 1,995 2.105 2.068 2.086 2.128 (Expected return, standard deviation, and capital asset pricing model) The following are the end-of-month prices for both the Standard & Poor's 500 Index and Nike's common stock a. Using the data in the popup Window, calculate the holding period returns for each of the months b. Calculate the average monthly return and the standard deviation for both the S&P 500 and Nike c. Develop a graph that shows the relationship between the Nike stock returns and the S&P 500 Index (Show the Nike returns on the vertical axis and the S&P 500 Index returns on the horizontal axis.) d. From your graph, describe the nature of the relationship between Nike stock returns and the returns for the S&P 500 Index a. Using the data in the table, calculate the holding period returns for each of the months for both the Standard & Poor's 500 Index and Nike's common stock and fill in the blanks below. (Round to two decimal places) NIKE NIKE RETURN S&P 500 INDEX S&P 500 RETURN 2014 May $76.91 $1.924 June 77.55 % Enter your answer in the edit fields and then click Check Answer 17 parts PA NIKE S&P 500 INDEX E 2014 May June July August September October November December 2015 January February March April May $76.91 77.55 77.13 78.55 89.20 92.97 99.29 96.15 $1,924 1,960 1,931 2,003 1,972 2,018 2,068 2,059 92.25 97.12 100.33 98.84 104.43 1,995 2.105 2,068 2,086 2.128 Print Done
Step by Step Solution
There are 3 Steps involved in it

Get step-by-step solutions from verified subject matter experts