

Answered step by step
Verified Expert Solution
Question
1 Approved Answer
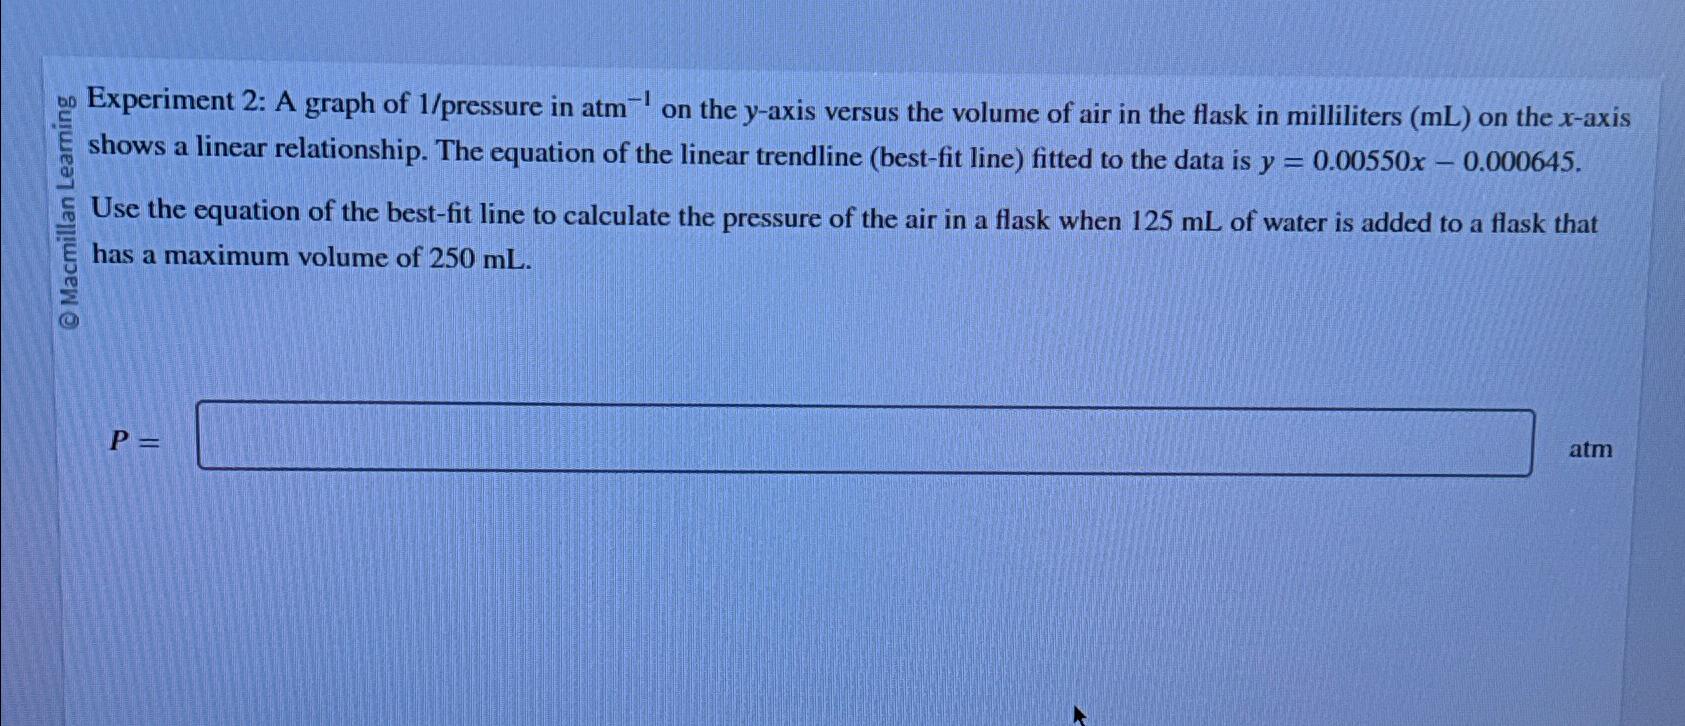
Experiment 2 : A graph of 1 / pressure in a t m - 1 on the y - axis versus the volume of air
Experiment : A graph of pressure in on the axis versus the volume of air in the flask in milliliters on the axis shows a linear relationship. The equation of the linear trendline bestfit line fitted to the data is
Use the equation of the bestfit line to calculate the pressure of the air in a flask when of water is added to a flask that has a maximum volume of
atm
Step by Step Solution
There are 3 Steps involved in it
Step: 1

Get Instant Access to Expert-Tailored Solutions
See step-by-step solutions with expert insights and AI powered tools for academic success
Step: 2

Step: 3
Ace Your Homework with AI
Get the answers you need in no time with our AI-driven, step-by-step assistance
Get Started
Chemical Principles
Authors: Steven S. Zumdahl, Donald J. DeCoste
7th edition
9781133109235, 1111580650, 978-1111580650