

Answered step by step
Verified Expert Solution
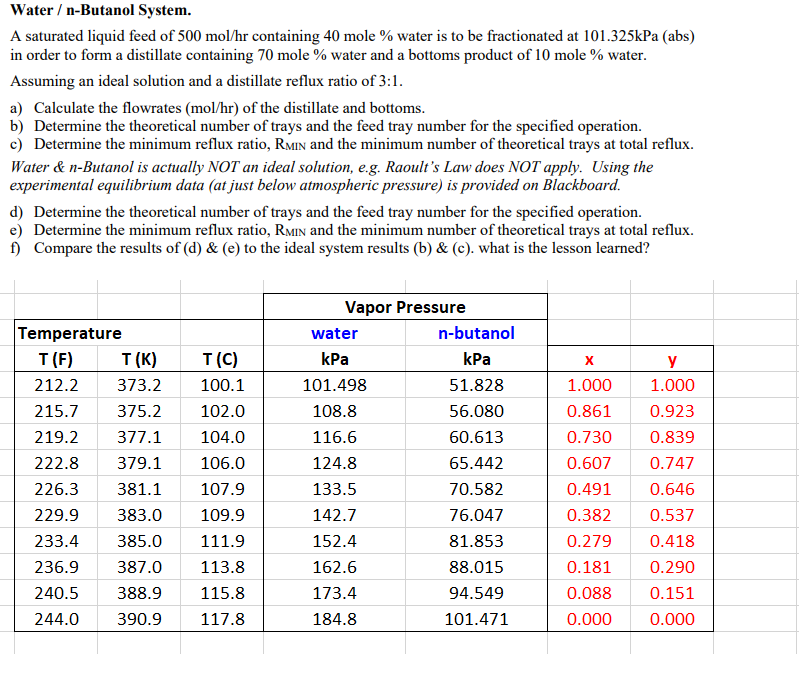
Question
1 Approved Answer
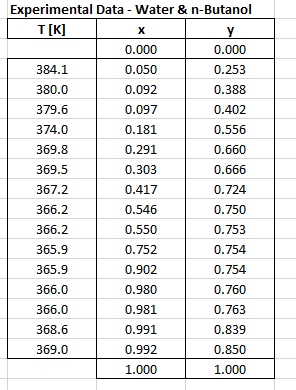
Experimental Data - Water & n-Butanol T[K] 0.000 0.000 384.1 0.050 0.253 380.0 0.092 0.388 379.6 0.097 0.402 374.0 0.181 0.556 369.8 0.291 0.660 369.5
Step by Step Solution
There are 3 Steps involved in it
Step: 1

Get Instant Access to Expert-Tailored Solutions
See step-by-step solutions with expert insights and AI powered tools for academic success
Step: 2

Step: 3
Ace Your Homework with AI
Get the answers you need in no time with our AI-driven, step-by-step assistance
Get Started
Data Analysis And Signal Processing In Chromatography
Authors: A. Felinger
1st Edition
0444820663, 978-0444820662