Question
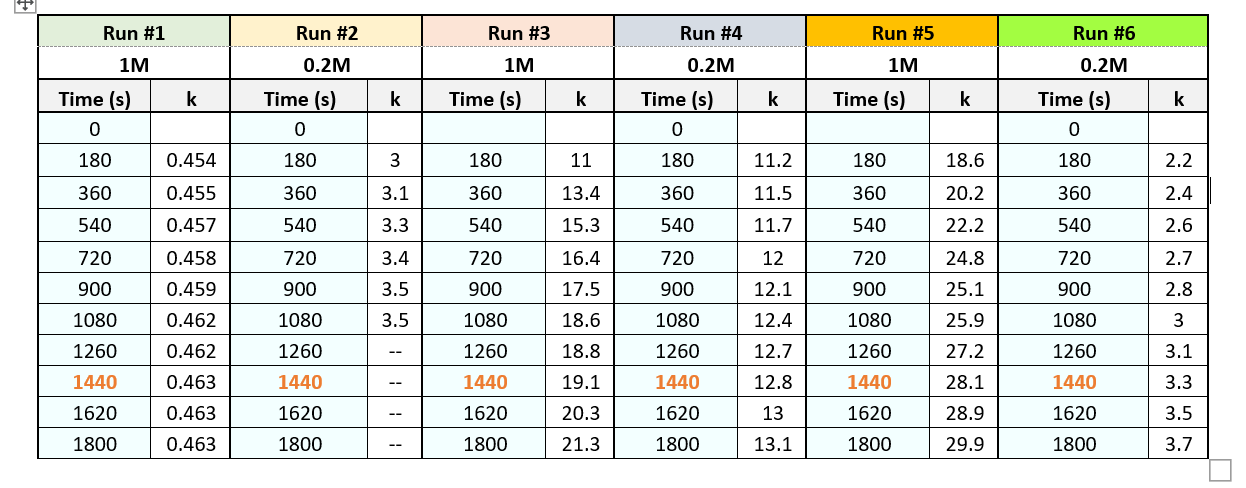
[Experimental Design Statistical Analysis] The following data are from a liquid-liquid diffusion experiment. It consists of measuring the electrical conductivity (k) as a function of
[Experimental Design Statistical Analysis] The following data are from a liquid-liquid diffusion experiment. It consists of measuring the electrical conductivity (k) as a function of time (t). The experimental design had 1 factor (concentration) and 2 levels (0.2M and 1 M), 3 independent replicates for each level for a total of 6 runs. The purpose is to obtain the slope of a linear graph of conductivity as a function of time. Each run was done at intervals of 180 seconds to 1800 seconds for a total of 10 data. The problem is that due to lack of time, run # 2 could not be finished and obtained only 6 points (up to 1080 seconds). Use a statistical method to validate the results of the regression and estimate the error of the slope Justify the answer. Note that the runs need to be compared if they have the same concentration, in other words, (compare Run 1 with 3 and 5, and compare Run 2 with 4 and 6)The units of k for the first run are microSiemens and the other miliSiemens. The data table is as follows:

Step by Step Solution
There are 3 Steps involved in it
Step: 1

Get Instant Access to Expert-Tailored Solutions
See step-by-step solutions with expert insights and AI powered tools for academic success
Step: 2

Step: 3

Ace Your Homework with AI
Get the answers you need in no time with our AI-driven, step-by-step assistance
Get Started


