Question
EXPERT HELP NEEDED for Question 3 and Question 5 ONLY: Please provide responses for Question 3 and Question 5 below. Included is information for the
EXPERT HELP NEEDED for Question 3 and Question 5 ONLY: Please provide responses for Question 3 and Question 5 below. Included is information for the other questions for your reference. I also included the responses for Question 3 and Question 5 that are not acceptable.
Background Information:
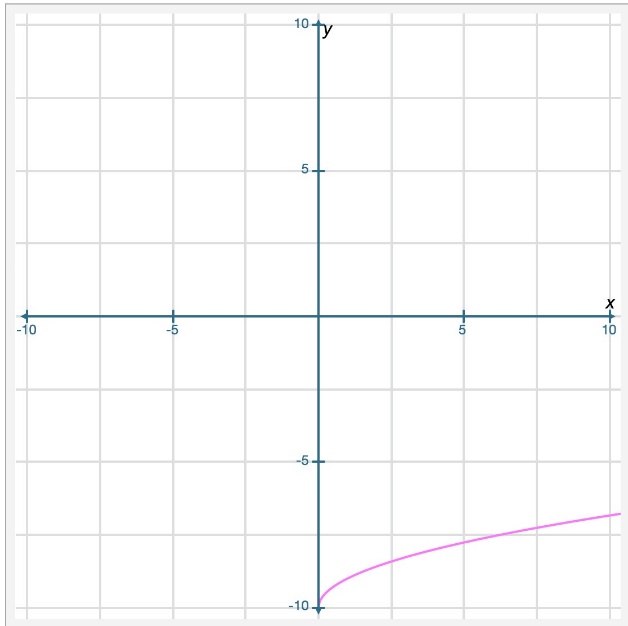
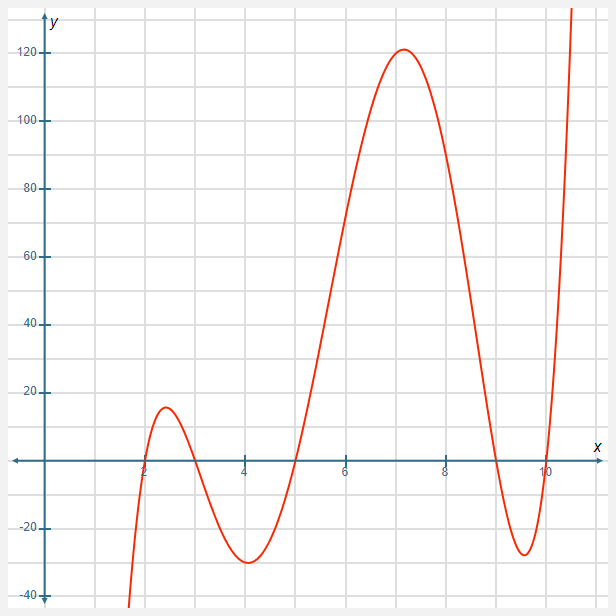
Jacob is driving through the mountains with his family.As they drive, the car's GPS device tracks their changing elevation.The graph shows the car's elevation from sea level in feet(y-axis)at different times measured in minutes(x-axis)from the start of the journey.Negative values of elevation represent heights below sea level.


Step by Step Solution
There are 3 Steps involved in it
Step: 1

Get Instant Access to Expert-Tailored Solutions
See step-by-step solutions with expert insights and AI powered tools for academic success
Step: 2

Step: 3

Ace Your Homework with AI
Get the answers you need in no time with our AI-driven, step-by-step assistance
Get Started


