Answered step by step
Verified Expert Solution
Question
1 Approved Answer
explain asset turnover, debt to equity ratio,debt ratio,times interest earned,cash flow to net income about the income statement below. Focus your calculations and analysis on
explain asset turnover, debt to equity ratio,debt ratio,times interest earned,cash flow to net income about the income statement below. Focus your calculations and analysis on the below ratios: 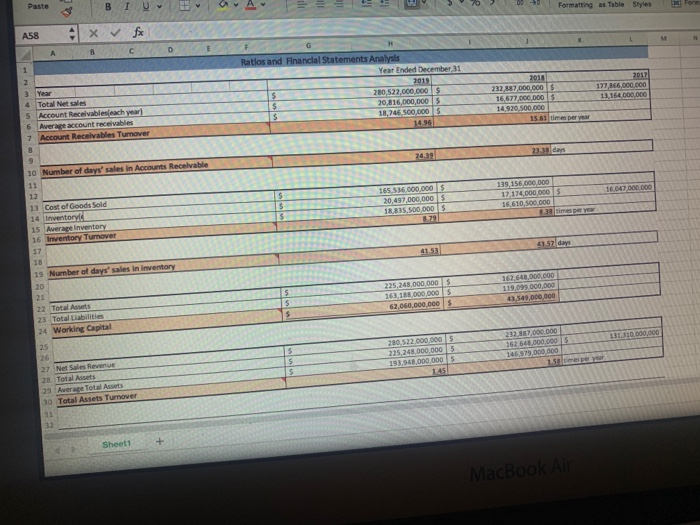
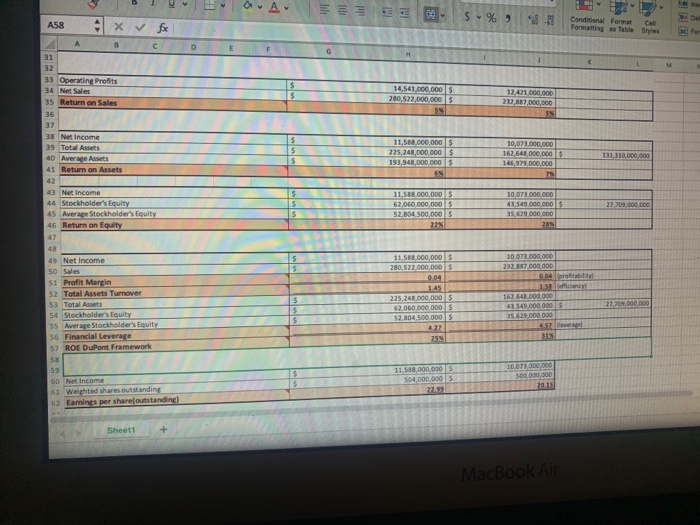
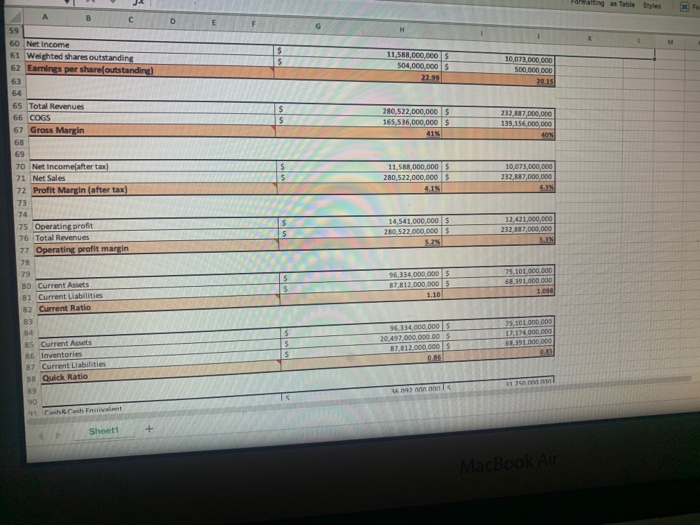
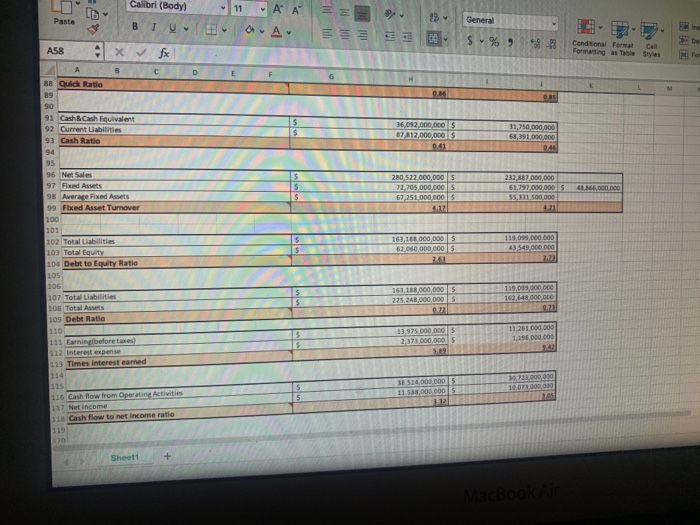
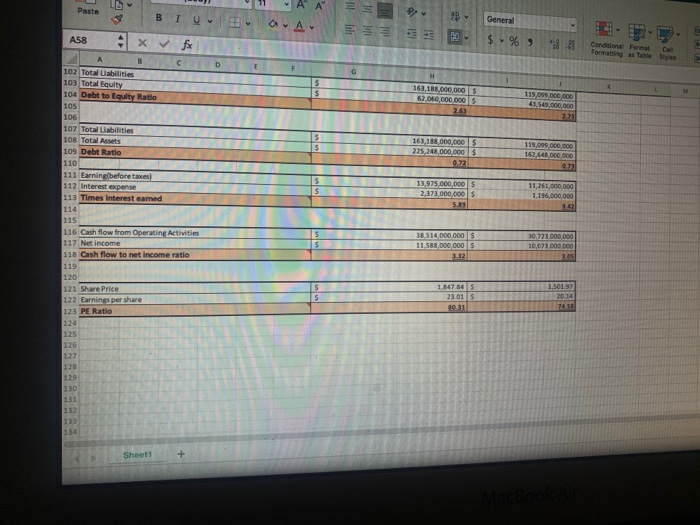
Paste AC BIU Formatting as Table Styles A58 X M B D 1 2017 177.166.000.000 13164 000 000 2 3 Year 4 Total Netales 5 Account Receivables each year) 6 Average account receivables 7 Account Receivables Turnover Ratlos and Financial Statements Analysis Year Ended December 31 2019 $ 280,522,000,000 $ 20,816,000,000 $ 18,746 500,000 14.96 2018 232,387,000,000 16,677,000,000 14,920, 500,000 15.61 times per year 23.30 days 24:39 9 16.047.000.000 139,156 000 000 17174 000 000 $ 16,610,500,000 8.3 times per year 165536.000.000 $ 20,497,000,000 16.835.500.000 8.79 $ 10 Number of days' sales in Accounts Receivable 11 12 13 Cost of Goods Sold 14 Inventory 15 Average Inventory 16 Inventory Turnover 17 18 19 Number of days' sales In Inventory 20 11.57 days 5 5 225.243.000.000 S 163,11 000 000 $ 62.060.000.000 162,648,000,000 119.099,000,000 01.549,000,000 22 Total Assets 23 Total Liabilities 24 Working Capital 25 000 000 5 212.887.000.000 362.648.000.000 146.379.000.000 150esper your 280 522.000.000 225.248.000.000 193.948.000.000 145 $ S 27 Net Sales Revenue 28 Total Assets 29 Average Total Assets 30 Total Assets Turnover 31 32 + Sheet1 MacBook Air 11 a. Av IH $ % 9 A58 8-23 x fx Conditional Format Call Formatting Table Slyes 14,541,000,000 280,522,000,000 12,421.000.000 232,387,000,000 B c 31 32 33 Operating Profits 34 Net Sales 35 Return on Sales 36 37 38 Net Income 39 Total Assets 40 Average Assets 41 Return on Assets 42 43 Net Income 44 Stockholder's Equity 45 Average Stockholder's Equity 46 Return on Equity 11.SERCOO 000 $ 225,248,000,000 $ 193,948,000,000 $ 10,073.000.000 162,648,000,000 $ 146,979,000,000 7 131,310.000.000 $ $ 10,073.000.000 43.549.000.000 35,629.000.000 27,209,000,000 11.588.000.000 62.060,000,000 52,804,500,000 $ 22 $ 11,588,000,000 $ 280,522.000.000 0.04 1.45 225.248.000,000 $ 62.060.000.000 $ 52,804,500,000 48 49 Net Income 50 Sales 51 Profit Margin 52 Total Assets Turnover 53 Total Assets 54 Stockholder's Equity 55 Average Stockholder's Equity 56 Financial Leverage 57 ROE DuPont Framework 58 59 50 Net Income 61 Weighted shares outstanding 62 Earnings per share outstanding) 10.073.000.000 232.887.000.000 0.04 taraftability 15 1625.000000 43.549.000.000 35.629 000 000 4.57Deve 27.03.000.000 11.588.000.000 504,000,000 5 10073.000.000 500,000,000 2015 Sheet1 MacBook Air Formatting as Table Styles $ $ 11,588,000,000 504,000,000 $ 22.99 10,073.000.000 500.000.000 20.15 $ $ 280,522,000,000 $ 165,536,000,000 41% 232,037,000,000 139,156,000,000 40 S $ 11,588,000,000 $ 280,522,000,000 4.15 10,073,000,000 232,887,000,000 43 59 60 Net Income 61 Weighted shares outstanding 62 Earings per share outstanding) 63 64 65 Total Revenues 66 COGS 67 Gross Margin 68 69 70 Net Income after tax) 71 Net Sales 72 Profit Margin (after tax) 73 74 75 Operating profit 76 Total Revenues 77 Operating profit margin 78 79 BD Current Assets 81 Current Liabilities 82 Current Ratio 83 84 85 Current Assets 86 Inventories B7 Current Liabilities 8 Quick Ratio 14,541,000,000 $ 280,522,000,000 12,421,000,000 232.887.000.000 96.334.000.000 87,812.000.000 1.10 25 101.000.000 68 191 000 000 1.SE 96,134,000,000 $ 20,497.000.000.00 $ 87 $12.000.000 S 086 25, 101.000.000 17 114.000.000 191.000.000 317 43 ann an 90 - 1 hh Fukia 6 Sheet1 + MacBook Air Calibri (Body) 11 ' ' 23 Paste General BT U a. Av ilil $ % 9 422 A58 x fx Conditional Format Cell Formatting as Table Styles To B M 0.86 ORS 35,092,000,000 87.812,000,000 $ 0.41 31,750.000.000 68,391,000,000 88 Quick Ratio 89 90 91 Cash & Cash Equivalent 92 Current Liabilities 93 Cash Ratio 94 95 96 Net Sales 97 Fixed Assets 98 Average Fixed Assets 99 Fixed Asset Turnover 100 101 102 Total Liabilities 103 Total Equity 104 Debt to Equity Ratio 105 280,522,000,000 S 72,705,000,000 S 67,251,000,000 4.17 232,887,000,000 61,797.000.000 55,131,500,000 48,366 000 000 163.103000,000 $ 62.060,000,000 $ 2.63 119.099.000.000 43.549.000.000 100 163,168,000,000 $ 225.248,000,000S 0.72 119.93.000 DO 162.648 000 000 0.70 107 Total Liabilities 108 Total Assets 109 Debt Ratio 110 111 Earning before taxes 112 Interest expense 113 Times interest earned 13,975.000.000 2,371.000.000 11,261.000.000 1,196.000.000 30723,000,000 10 011000000 es 115 116 Cash flow from Operating Activities 117 Net Income 118 Cash flow to net income ratio 38 514,000 000 11 SB,000 DOD 312 Sheet1 MacBook Paste BIU 23 avau il lali General $ % 9 Condos Format D 163,188,000,000 $ 62.060.000.000 S 2751 119.099 DCC 600 41 549,000,000 2.73 A58 x fe A B C 102 Total abilities 103 Total Equity 104 Debt to Equity Ratio 105 106 107 Total abilities 108 Total Assets 109 Debt Ratio 110 111 Earning before taxes 112 Interest expense 113 Times Interest earned 114 115 116 Cash flow from Operating Activities 117 Net income 118 Cash flow to net income ratio 163,188,000,000 $ 225.248,000,000 $ 0.72 119,099.000.000 162,448,0,000 0.72 13,975.000.000 $ 2,373,000,000 $ 5.53 11,261,000,000 1,196,000,000 38,514,000,000 11.588 000 000 $ 30.723.000.000 10,071.000.000 2.05 1.847.845 23.015 1,50197 20.14 120 121 Share Price 122 Earnings per share 123 PE Ratio 124 125 126 127 128 129 130 131 132 134 Sheet1 + PPE efficiency
Fixed asset turnover
Leverage Ratios:
Debt-to-equity ratio
Debt Ratio
Other ratios:
Times interest earned
Cash flow to Net Income
PE ratio


Step by Step Solution
There are 3 Steps involved in it
Step: 1

Get Instant Access to Expert-Tailored Solutions
See step-by-step solutions with expert insights and AI powered tools for academic success
Step: 2

Step: 3

Ace Your Homework with AI
Get the answers you need in no time with our AI-driven, step-by-step assistance
Get Started


