- Explain Carter + Smith Company business and sources of its foreign currency exchange rate risk. You can analyze Annexes 2 and 3.
- Choose one of the contracts from Annex 3 and explain the dynamics of the current hedging with NDFs with calculating profits and losses in spot and forward markets and the implied exchange rate with this particular contract.
READ THE INFO BELOW
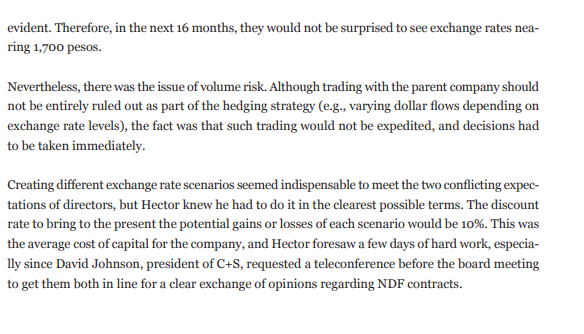
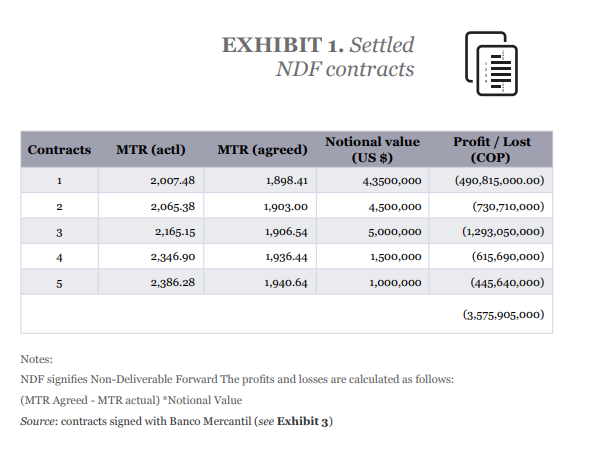
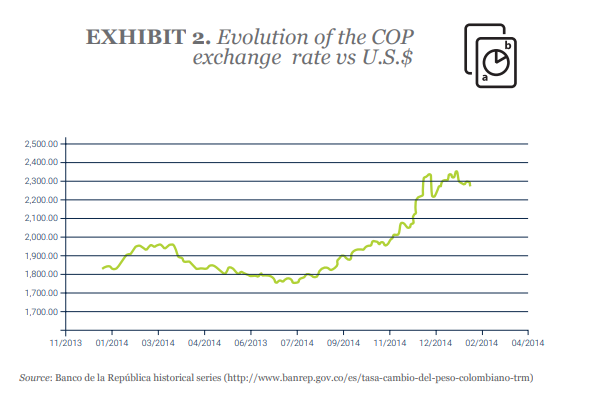
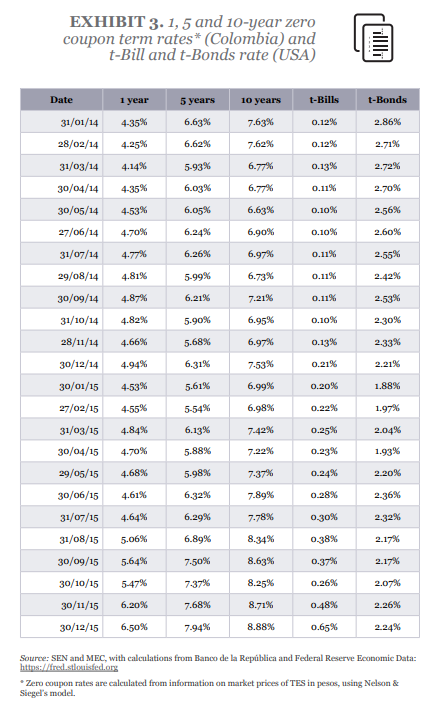
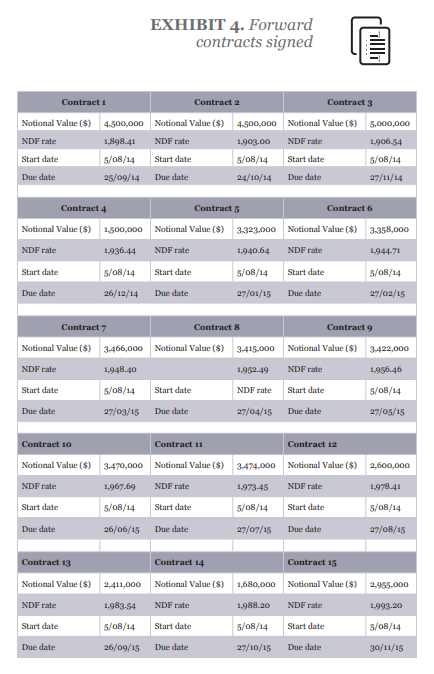
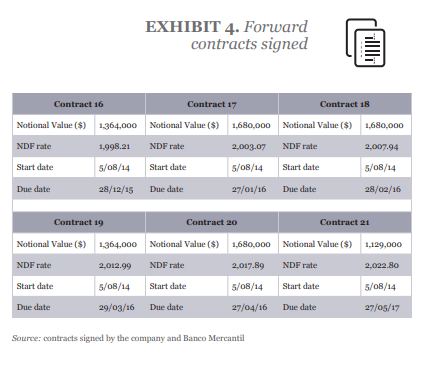
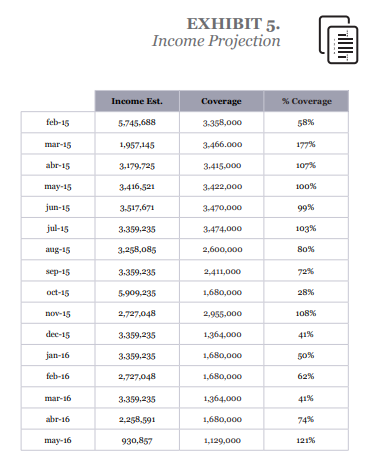
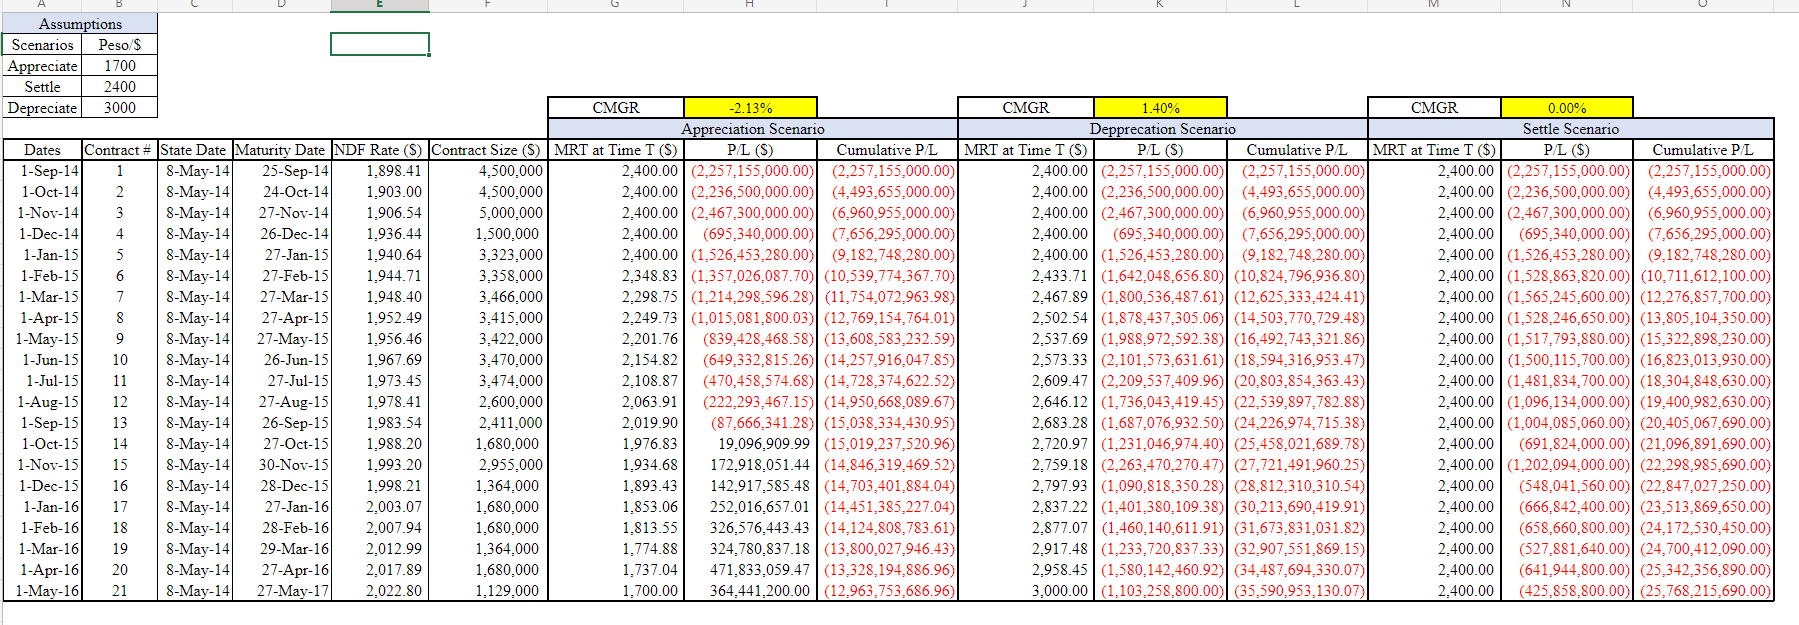
INTRODUCTION Carter + Smith (C+S) was an American construction company that, by the end of 2014, was about to complete a port project in Colombia. The company received most of its revenue in U.S. dollars, while virtually all its operating expenses were in Colombian pesos. By August 2014, given the strong revaluation of the peso against the dollar, the company decided to hedge its currency risk with NDF (Non-Deliverable Forward) contracts. At that time, the Market Representative Rate (TRM) was at 1,873.75 Colombian pesos per dollar. At the beginning of 2015, however, the story was different. On January 29, 2015, when Hector Ramirez, C+S finance manager, was preparing his monthly presentation to the board of directors, the TRM was at 2,362.42 pesos per dollar, experiencing a devaluation of more than 26% in those last five months. That afternoon, Hctor looked thoughtfully at the latest report from the Banco Mercantil with whom he contracted the NDF, which showed accumulated losses amounting to more than 3.6 bi- llion pesos, approximately 1.5 million dollars. The previous week, he had already attended a call from David Johnson, president of C + S, showing his concern about these contracts, and indica- ted that this point was going to be explicitly addressed at the next board meeting. Hector reflected that it was going to be difficult to explain these losses in the NDF to the board in the following week. In particular, if the exchange rate remained at an average of 2,400 pesos per dollar for the coming months, these losses would amount to more than 16.5 billion pesos for the 16 contracts in force up until the completion of the project in May 2017. However, Hector argued: "more pesos are being obtained for each dollar received. Moreover, if the situation reverses, and the peso revaluation environment returns as in 2014, gains in NDF contracts would offset the lower amount of dollars received." Hector understood that his main challenge before the board was to adequately explain the me- chanics of the hedging scheme implemented by C+S to cover exchange rate risk. For example, Hector had to clearly set out to the directors the costs and benefits of closing the hedge imme- diately or, conversely, letting the contracts expire on the agreed dates. In addition to the uncertainty concerning the exchange rate evolution and the losses that it could generate in the NDFs, Hector faced another problem. The issue was the parent company's ad- justments at the beginning of 2015 on the income in dollars over the next 16 months until the completion of the project. Hector had to show that these new revenue estimates created excess coverage for C+S over a number of months, where fewer dollars were received than were initially covered in the NDF contracts, but shortfalls in coverage for others, where more dollars would be received than were covered by the NDFs. Although Hector was not clear on the net impact of the situation regarding his coverage scheme, he knew that it would be another of the high points to be discussed at the next board meeting. Di- rectors would have to be shown as clearly as possible at the meeting, the additional risk of being over or under covered by a devaluation or revaluation scenario throughout the next 16 months. Exchange rate risk For Hector, it was clear that the exchange rate risk was something that he could not control and, consequently, the theory said that it had to be covered in the best possible way. He understood that in moments of devaluation (increase in the price of the foreign currency), as at present, or revaluation (a fall in the foreign currency) as was the case in August 2014, non-operational pro- fits or losses were generated that were sufficiently significant to change the net results of the com- pany. (See Exhibit 2 for dollar/peso exchange rate movements.) In the jargon of the financiers, Hector was short on NDF contracts as he sold the dollars he received from his parent company to convert them into Colombian pesos and meet his opera- ting obligations in pesos. Unlike Forward contracts, NDFs only receive or pay for gains or losses without the physical delivery or receipt of the contract's underlying dollars. When the exchan- ge rate fell, as he and many other experts believed it would in August 2014, primarily because of the high level of confidence of the investing public given the good growth expectations in the Colombian economy, as well as the increasing levels of foreign investment, then NDFs offset the lower level of pesos they received for each dollar sold. In contrast, the differential in interest ra- tes between the United States and Colombia led to a significant devaluation of the Colombian peso, which in 2014 was the second country with the highest short-term interest rate. Exhibit 3 shows the zero-coupon rates implicit in the bonds issued by the Banco de la Repblica (TES) for different terms and the short-term (t-Bills) and long-term (t-Bonds) bonds issued by the United States Federal Reserve. As can be observed, the enormous differential in interest rates led to the prediction of a significant devaluation of the Colombian peso. The trend of strengthening the peso against the dollar has been dramatically reversed since January 2015, when the exchange rate was devalued due to a sharp drop in oil prices towards the end of 2014. That is, now, although more pesos are earned for each dollar sold, losses on NDF contracts offset the exchange "gain." In a scenario where the peso devalues against the dollar, the futures contracts settle any extraordinary gain on the difference in exchange. That was precisely the argument made against several directors when Hector presented the proposal to the board that approved the hedge. However, he recalled that his main argument was that they are a construc- tion company and not financial speculators seeking to profit from the exchange rate differential. It was clear to Hector that the board would evaluate his financial management by net income and could not use too many financial or economic technicalities to explain this from non-operating gains or losses due to exchange rate movements. In fact, it was not easy for Hector to sell the idea of financial hedges that previous year, and he knew there were several directors who had doubts as to whether allowing the use of such hedges had been the best decision, especially now that the project was only 16 months away from completion. The contracts Once the board's decision on financial hedging was approved, Hector contacted Banco Mercantil at the end of July 2014, which offered him NDFs as the best hedging alternative. After determining in as much detail as possible the expected revenues in dollars according to the requirements of the project, on August 5, 21 NDF contracts were signed with the different notio- nal or reference values (see Exhibit 4). For example, based on the specifications of the first contract signed, if the exchange rate, TC, was below the agreed rate or forward price of 1,898.41 pesos per dollar, the lower peso entry was off- set by the contract's earnings. This would be equal to 1,898.41-TC multiplied by the notional va- lue of the contract, which for this case was 4.5 million dollars; obviously, the opposite would be the case if the TC were above the NDF rate. The current situation In addition to the problem of the devaluation of the peso against the dollar, Hector was facing a further challenge: revenue projections had varied since late July 2014 due to the dynamic nature of this type of project, so he was also confronting a volume risk (dollars received versus dollars covered). Exhibit 5 presents the new revenue estimates and the respective NDF contracts for each of the remaining 16 months for project completion. On average, coverage currently represented 83% of expected revenues; however, there were ca- ses such as in February 2015 where coverage was only 58%, while others, for instance, in March, where coverage was 177%. Hctor was unsure whether this situation favored or disfavored him, but the truth was that this issue would be debated at the board meeting. Alternatives Hector clearly understood that it was necessary to present to the board the average implied rate for each of the contracts (assuming an exchange rate of 2,400 pesos per dollar) in order to be able to evaluate the effectiveness of the hedge globally, and not just focus the discussion on the loss in the forward market. Likewise, he had to take the available alternatives to the board, which after much thought redu- ced them to two: 1) leave the hedge as it was; or, 2) settle the positions with the current dollar at 2,400 pesos, assuming the present value of the losses or gains for each of the contracts. Both alternatives have advantages and disadvantages, and Hector knew that much depended on the expectations held regarding the evolution of the exchange rate for the next 16 months. Some directors were pessimistic about the Colombian economy, so they expected an even greater de- valuation that would bring the exchange rate to 3,000 pesos per dollar. Hector had received an email from a director with several exchange rate forecasts even two days earlier, where the con- sensus from those sources was a further devaluation of the peso to around 3,000 pesos per dollar. However, other directors set their expectations in the opposite direction. They argued that subs- tantial investments in infrastructure would make the country receive enough dollars to reverse the devaluation trend and that signs of a reversal in the exchange rate were already becoming evident. Therefore, in the next 16 months, they would not be surprised to see exchange rates nea- ring 1,700 pesos. Nevertheless, there was the issue of volume risk. Although trading with the parent company should not be entirely ruled out as part of the hedging strategy (e.g., varying dollar flows depending on exchange rate levels), the fact was that such trading would not be expedited, and decisions had to be taken immediately. Creating different exchange rate scenarios seemed indispensable to meet the two conflicting expec- tations of directors, but Hector knew he had to do it in the clearest possible terms. The discount rate to bring to the present the potential gains or losses of each scenario would be 10%. This was the average cost of capital for the company, and Hector foresaw a few days of hard work, especia- lly since David Johnson, president of C+S, requested a teleconference before the board meeting to get them both in line for a clear exchange of opinions regarding NDF contracts. EXHIBIT 1. Settled NDF contracts Contracts MTR (agreed) MTR (actl) 2,007.48 2,065-38 Notional value (US$) 4.3500,000 1 1,898.41 2 1,903.00 4,500,000 Profit / Lost (COP) (490,815,000.00) (730,710,000) (1,293,050,000) (615,690,000) (445,640,000) 3 2,165.15 1,906.54 5,000,000 4 2.346.90 1,936.44 1,500,000 5 2,386.28 1,940.64 1,000,000 (3,575.905,000) Notes: NDF signifies Non-Deliverable Forward The profits and losses are calculated as follows: (MTR Agreed - MTR actual) "Notional Value Source: contracts signed with Banco Mercantil (see Exhibit 3) EXHIBIT 2. Evolution of the COP exchange rate vs U.S.$ 2,500.00 2,400.00 2,300.00 am 2,200.00 2,100.00 2,000.00 1,900.00 1,800.00 1,700.00 1,700.00 11/2013 01/2014 03/2014 04/2014 06/2013 07/2014 09/2014 11/2014 12/2014 02/2014 04/2014 Source: Banco de la Repblica historical series (http://www.banrep.gov.co/es/tasa-cambio-del-peso-colombiano-trm) EXHIBIT 3.1,5 and 10-year zero coupon term rates* (Colombia) and t-Bill and t-Bonds rate (USA) Date 1 year 10 years t-Bills t-Bonds 5 years 6.63% 4-35% 7.63% 0.12% 2.86% 4.25% 6.62% 7.62% 0.12% 2.71% 31/01/14 28/02/14 31/03/14 30/04/14 4.14% 5.93% 6.77% 0.13% 2.72% 4-35% 6.03% 6.77% 0.11% 2.70% 30/05/14 4-53% 6.05% 6.63% 0.10% 2.56% 27/06/14 4.70% 6.24% 6.90% 0.10% 2.60% 31/07/14 4.77% 6.26% 6.97% 0.11% 2-55% 29/08/14 4.81% 5.99% 0.11% 2.42% 6.73% 7.21% 30/09/14 4.87% 6.21% 0.11% 2.53% 31/10/14 4.82% 5.90% 6.95% 0.10% 2.30% 4.66% 5.68% 6.97% 0.13% 2-33% 28/11/14 30/12/14 30/01/15 4.94% 6.31% 7-53% 0.21% 2.21% 4-53% 5.61% 6.99% 0.20% 1.88% 27/02/15 4-55% 5-54% 6.98% 0.22% 1.97% 4.84% 6.13% 7-42% 0.25% 2.04% 31/03/15 30/04/15 4.70% 5.88% 7.22% 0.23% 1.93% 29/05/15 4.68% 5.98% 7-37% 0.24% 2.20% 30/06/15 4.61% 6.32% 7.89% 0.28% 2.36% 4.64% 6.29% 7.78% 0-30% 2.32% 5.06% 6.89% 8.34% 0.38% 2.17% 31/07/15 31/08/15 30/09/15 30/10/15 5.64% 7-50% 8.63% 0.37% 2.17% 5-47% 7-37% 8.25% 0.26% 2.07% 30/11/15 6.20% 7.68% 8.71% 0.48% 2.26% 30/12/15 6.50% 7.94% 8.88% 0.65% 2.24% Source: SEN and MEC, with calculations from Banco de la Repblica and Federal Reserve Economic Data: https://fred.stlossfed.org * Zero coupon rates are calculated from information on market prices of TES in pesos, using Nelson & Siegel's model. EXHIBIT 4. Forward contracts signed Contract 1 Contract 2 Contract 3 Notional Value (8) 4.500,000 Notional Value (8) 4.500,000 Notional Value (8) 5,000,000 NDF rate 1,898.41 NDF rate 1.903.00 NDF rate 1.906.54 Start date 5/08/14 Start date 5/08/14 Start date 5/08/14 Due date 25/09/14 Due date 24/10/14 Due date 27/11/14 Contract 4 Contract 5 Contract 6 Notional Value ($) 1.500,000 National Value ($) 3323,000 Notional Value ($) 3.358,000 NDF rate 1.936.44 NDF rate 1.940.64 NDF rate 1.944-71 Start date 5/08/14 Start date 5/08/14 Start date 5/08/14 Due date 26/12/14 Due date 27/01/15 Due date 27/02/15 Contract 7 Contracts Contract 9 Notional Value (8) 3.466,000 National Value ($) 3.415,000 Notional Value ($) 3.422,000 NDF rate 1,948.40 1.952.49 NDF rate 1.956.46 Start date 5/08/14 Start date NDF rate Start date 5/08/14 Due date 27/03/15 Due date 27/04/15 Due date 27/05/15 Contract 10 Contract 11 Contract 12 Notional Value (8) 3.470,000 Notional Value ($) 3.474,000 National Value ($) 2,600,000 NDF rate 1,967.69 NDF rate 1.973.45 NDF rate 1.978.41 Start date 5/08/14 Start date 5/08/14 Start date 5/08/14 Due date 26/06/15 Due date 27/07/15 Due date 27/08/15 Contract 13 Contract 14 Contract 15 Notional Value () 2,411,000 National Value ($) 1,680,000 Notional Value () 2.955,000 NDF rate 1.983.54 NDF rate 1.988.20 NDF rate 1.993.20 Start date 5/08/14 Start date 5/08/14 Start date 5/08/14 Due date 26/09/15 Due date 27/10/15 Due date 30/11/15 EXHIBIT 4. Forward contracts signed Contract 16 Contract 17 Contract 18 Notional Value ($) 1,364,000 Notional Value ($) 1,680,000 Notional Value ($) 1,680,000 NDF rate 1.998.21 NDF rate 2,003.07 NDF rate 2,007.94 Start date 5/08/14 Start date 5/08/14 Start date 5/08/14 Due date 28/12/15 Due date 27/01/16 Due date 28/02/16 Contract 19 Contract 20 Contract 21 National Value ($) 1.364,000 Notional Value ($) 1,680,000 Notional Value ($) 1,129,000 NDF rate 2,012.99 NDF rate 2,017.89 NDF rate 2,022.80 Start date 5/08/14 Start date 5/08/14 Start date 5/08/14 Due date 29/03/16 Due date 27/04/16 Due date 27/05/17 Source: contracts signed by the company and Banco Mercantil EXHIBIT 5. Income Projection Income Est. Coverage % Coverage feb-15 5.745.688 3.358,000 58% mar-15 1,957,145 3.466.000 177% abr-15 3.179.725 3.415.000 107% may-15 3,416.521 3.422,000 100% jun-15 3.517,671 3.470,000 99% jul-15 3.359,235 3.474,000 103% aug-15 3.298,085 80% 2,600,000 2.411,000 sep-15 3.359,235 72% oct-15 5.909.235 1,680,000 28% nov-15 2,727,048 2,955,000 108% dec-15 3.359,235 1.364.000 41% jan-16 1,680,000 50% 3.359,235 2,727,048 feb-16 1,680,000 62% mar-16 3,359,235 1.364.000 41% abr-16 2.258,591 1,680,000 74% may-16 930,857 1,129,000 121% M N Assumptions Scenarios Peso/$ Appreciate 1700 Settle 2400 Depreciate 3000 CMGR -2.13% Appreciation Scenario Dates Contract # State Date Maturity Date NDF Rate ($) Contract Size (S) MRT at Time T (S) P/L (S) Cumulative P/L 1-Sep-14 1 8-May-14 25-Sep-14 1.898.41 4,500,000 2.400.00 (2,257,155,000.00) (2,257,155,000.00) 1-Oct-14 2 8-May-14 24-Oct-141 1.903.00 4.500.000 2.400.00 (2,236,500,000.00) (4,493,655,000.00) 1-Nov-14 3 8-May-14 27-Nov-14 1,906.54 5,000,000 2.400.00(2,467,300,000.00 6,960,955,000.00) 1-Dec-14 4 8-May-14 26-Dec-14 1.936.44 1.500.000 2.400.00 (695,340.000.00)| (7,656,295,000.00) 1-Jan-15 5 8-May-14 27-Jan-15 1.940.64 3,323.000 2.400.00 (1,526,453,280.00) 9,182,748,280.00) 1-Feb-15 6 8-May-14 27-Feb-151 1.944.71 3,358.000 2.348.83 (1,357,026,087.70) (10,539,774,367.70) 1-Mar-15 7 8-May-14 27-Mar-151 1.948.40 3.466.000 2,298.75 (1,214,298,596.28) (11,754,072,963.98) 1-Apr-15 8 8-May-14 27-Apr-151 1.952.49 3,415.000 2.249.73 (1,015.081,800.03) (12,769,154,764.01) 1-May-15 9 8-May-14 27-May-151 1.956.46 3.422.000 2.201.76 (839,428,468.58) (13,608,583,232.59) 1-Jun-15) 10 8-May-141 26-Jun-151 1.967.69 3,470,000 2.154.82 (649,332,815.26) (14,257,916,047.85) 1-Jul-15 11 8-May-14 27-Jul-151 1.973.45 3.474,000 2.108.87 (470,458,574.68) (14,728,374,622.52) 1-Aug-15 12 8-May-14 27-Aug-15 1.978.41 2.600,000 2,063.91 (222,293,467.15) (14,950,668,089.67) 1-Sep-15 13 8-May-14 26-Sep-151 1.983.54 2.411,000 2.019.90 (87.666,341.28) (15,038,334,430.95) 1-Oct-15 14 8-May-14 27-Oct-15 1.988.20 1.680.000 1.976.83 19.096.909.99 (15,019,237,520.96) 1-Nov-15 15 8-May-14 30-Nov-151 1.993.20 2,955,000 1,934.68 172.918.051.44 (14,846,319,469.52) 1-Dec-15 16 8-May-14 28-Dec-15 1.998.21 1,364,000 1.893.43 142.917.585.48 (14,703,401,884.04) 1-Jan-16 17 8-May-14 27-Jan-16 2.003.07 1.680.000 1.853.06 252.016,657.01 (14,451,385,227.04) 1-Feb-16 18 8-May-14 28-Feb-16 2.007.94 1.680,000 1.813.55 326,576.443.43 (14,124,808,783.61) 1-Mar-16 19 8-May-14 29-Mar-16 2,012.99 1,364,000 1,774.88 324,780.837.18 (13,800,027,946.43) 1-Apr-16 20 8-May-14 27-Apr-16 2.017.89 1.680.000 1.737.04 471.833,059.47 (13,328,194,886.96) 1-May-16 21 8-May-14 27-May-17 2.022.80 1.129.000 1.700.00 364.441,200.00 (12.963,753,686.96) CMGR 1.40% CMGR 0.00% Depprecation Scenario Settle Scenario MRT at Time T (S) P/L (S) Cumulative PL MRT at Time T ($) PL ($) Cumulative P/L 2.400.00 (2,257,155,000.00) (2,257,155,000.00) 2.400.00 (2,257,155,000.00) (2,257,155,000.00) 2.400.00 (2,236,500,000.00) (4,493,655,000.00) 2.400.00 (2.236,500,000.00) (4.493,655,000.00) 2.400.00 (2.467,300,000.00) (6.960,955,000.00) 2.400.00 (2.467,300,000.00)| (6,960,955,000.00) 2.400.00 (695,340,000.00) (7.656,295,000.00) 2,400.00 (695,340,000.00)| (7,656,295,000.00) 2.400.00 (1,526,453,280.00) (9.182,748,280.00) 2.400.00 (1.526,453,280.00) 9.182,748,280.00) 2.433.71 (1,642,048,656.80) (10.824,796,936.80) 2.400.00(1,528,863,820.00) (10.711,612,100.00) 2.467.89 (1,800,536,487.61) (12,625,333,424.41) 2.400.00 (1,565,245,600.00) (12.276.857,700.00) 2.502.54 (1.878,437,305.06 (14,503.770.729.48) 2.400.00 (1,528.246,650.00) (13.805,104,350.00) 2.537.69 (1.988.972.592.38) (16,492,743,321.86 2.400.00 (1,517,793,880.00)| (15,322,898,230.00) 2.573.33 (2.101,573,631.61) (18.594,316,953.47) 2.400.00 (1.500.115,700.00) (16.823,013,930.00) 2.609.47 (2,209,537,409.96) (20,803,854,363.43) 2.400.00 (1,481,834,700.00) (18,304,848,630.00) 2.646.12(1.736,043,419.45) (22,539,897,782.88) 2.400.00 (1,096,134,000.00) (19,400,982,630.00) 2.683.28(1,687,076,932.50)| (24,226,974.715.38) 2.400.00 (1,004,085,060.00) (20,405,067,690.00) 2.720.97 (1.231,046,974.40)(25,458,021,689.78) 2,400.00 (691,824,000.00)| (21,096,891,690.00) 2.759.18 (2,263,470,270.47)| (27,721,491.960.25) 2.400.00 (1,202,094,000.00) (22,298,985,690.00) 2.797.93 (1,090,818,350.28) (28,812,310,310.54) 2,400.00 (548,041,560.00) (22,847,027,250.00) 2.837.22(1,401,380.109.38) (30,213,690,419.91) 2.400.00 (666,842,400.00) (23,513,869,650.00) 2.877.07 (1,460.140,611.91) (31,673,831,031.82) 2.400.00 (658,660,800.00) (24,172,530,450.00) 2.917.48 (1,233,720,837.33) (32,907,551.869.15) 2,400.00 (527,881,640.00) (24,700,412,090.00) 2.958.45(1,580.142.460.92) (34,487,694,330.07) 2.400.00 (641,944,800.00) (25,342,356,890.00) 3,000.00 (1,103,258,800.00) (35,590,953,130.07) 2.400.00 (425,858,800.00)|(25,768,215,690.00) INTRODUCTION Carter + Smith (C+S) was an American construction company that, by the end of 2014, was about to complete a port project in Colombia. The company received most of its revenue in U.S. dollars, while virtually all its operating expenses were in Colombian pesos. By August 2014, given the strong revaluation of the peso against the dollar, the company decided to hedge its currency risk with NDF (Non-Deliverable Forward) contracts. At that time, the Market Representative Rate (TRM) was at 1,873.75 Colombian pesos per dollar. At the beginning of 2015, however, the story was different. On January 29, 2015, when Hector Ramirez, C+S finance manager, was preparing his monthly presentation to the board of directors, the TRM was at 2,362.42 pesos per dollar, experiencing a devaluation of more than 26% in those last five months. That afternoon, Hctor looked thoughtfully at the latest report from the Banco Mercantil with whom he contracted the NDF, which showed accumulated losses amounting to more than 3.6 bi- llion pesos, approximately 1.5 million dollars. The previous week, he had already attended a call from David Johnson, president of C + S, showing his concern about these contracts, and indica- ted that this point was going to be explicitly addressed at the next board meeting. Hector reflected that it was going to be difficult to explain these losses in the NDF to the board in the following week. In particular, if the exchange rate remained at an average of 2,400 pesos per dollar for the coming months, these losses would amount to more than 16.5 billion pesos for the 16 contracts in force up until the completion of the project in May 2017. However, Hector argued: "more pesos are being obtained for each dollar received. Moreover, if the situation reverses, and the peso revaluation environment returns as in 2014, gains in NDF contracts would offset the lower amount of dollars received." Hector understood that his main challenge before the board was to adequately explain the me- chanics of the hedging scheme implemented by C+S to cover exchange rate risk. For example, Hector had to clearly set out to the directors the costs and benefits of closing the hedge imme- diately or, conversely, letting the contracts expire on the agreed dates. In addition to the uncertainty concerning the exchange rate evolution and the losses that it could generate in the NDFs, Hector faced another problem. The issue was the parent company's ad- justments at the beginning of 2015 on the income in dollars over the next 16 months until the completion of the project. Hector had to show that these new revenue estimates created excess coverage for C+S over a number of months, where fewer dollars were received than were initially covered in the NDF contracts, but shortfalls in coverage for others, where more dollars would be received than were covered by the NDFs. Although Hector was not clear on the net impact of the situation regarding his coverage scheme, he knew that it would be another of the high points to be discussed at the next board meeting. Di- rectors would have to be shown as clearly as possible at the meeting, the additional risk of being over or under covered by a devaluation or revaluation scenario throughout the next 16 months. Exchange rate risk For Hector, it was clear that the exchange rate risk was something that he could not control and, consequently, the theory said that it had to be covered in the best possible way. He understood that in moments of devaluation (increase in the price of the foreign currency), as at present, or revaluation (a fall in the foreign currency) as was the case in August 2014, non-operational pro- fits or losses were generated that were sufficiently significant to change the net results of the com- pany. (See Exhibit 2 for dollar/peso exchange rate movements.) In the jargon of the financiers, Hector was short on NDF contracts as he sold the dollars he received from his parent company to convert them into Colombian pesos and meet his opera- ting obligations in pesos. Unlike Forward contracts, NDFs only receive or pay for gains or losses without the physical delivery or receipt of the contract's underlying dollars. When the exchan- ge rate fell, as he and many other experts believed it would in August 2014, primarily because of the high level of confidence of the investing public given the good growth expectations in the Colombian economy, as well as the increasing levels of foreign investment, then NDFs offset the lower level of pesos they received for each dollar sold. In contrast, the differential in interest ra- tes between the United States and Colombia led to a significant devaluation of the Colombian peso, which in 2014 was the second country with the highest short-term interest rate. Exhibit 3 shows the zero-coupon rates implicit in the bonds issued by the Banco de la Repblica (TES) for different terms and the short-term (t-Bills) and long-term (t-Bonds) bonds issued by the United States Federal Reserve. As can be observed, the enormous differential in interest rates led to the prediction of a significant devaluation of the Colombian peso. The trend of strengthening the peso against the dollar has been dramatically reversed since January 2015, when the exchange rate was devalued due to a sharp drop in oil prices towards the end of 2014. That is, now, although more pesos are earned for each dollar sold, losses on NDF contracts offset the exchange "gain." In a scenario where the peso devalues against the dollar, the futures contracts settle any extraordinary gain on the difference in exchange. That was precisely the argument made against several directors when Hector presented the proposal to the board that approved the hedge. However, he recalled that his main argument was that they are a construc- tion company and not financial speculators seeking to profit from the exchange rate differential. It was clear to Hector that the board would evaluate his financial management by net income and could not use too many financial or economic technicalities to explain this from non-operating gains or losses due to exchange rate movements. In fact, it was not easy for Hector to sell the idea of financial hedges that previous year, and he knew there were several directors who had doubts as to whether allowing the use of such hedges had been the best decision, especially now that the project was only 16 months away from completion. The contracts Once the board's decision on financial hedging was approved, Hector contacted Banco Mercantil at the end of July 2014, which offered him NDFs as the best hedging alternative. After determining in as much detail as possible the expected revenues in dollars according to the requirements of the project, on August 5, 21 NDF contracts were signed with the different notio- nal or reference values (see Exhibit 4). For example, based on the specifications of the first contract signed, if the exchange rate, TC, was below the agreed rate or forward price of 1,898.41 pesos per dollar, the lower peso entry was off- set by the contract's earnings. This would be equal to 1,898.41-TC multiplied by the notional va- lue of the contract, which for this case was 4.5 million dollars; obviously, the opposite would be the case if the TC were above the NDF rate. The current situation In addition to the problem of the devaluation of the peso against the dollar, Hector was facing a further challenge: revenue projections had varied since late July 2014 due to the dynamic nature of this type of project, so he was also confronting a volume risk (dollars received versus dollars covered). Exhibit 5 presents the new revenue estimates and the respective NDF contracts for each of the remaining 16 months for project completion. On average, coverage currently represented 83% of expected revenues; however, there were ca- ses such as in February 2015 where coverage was only 58%, while others, for instance, in March, where coverage was 177%. Hctor was unsure whether this situation favored or disfavored him, but the truth was that this issue would be debated at the board meeting. Alternatives Hector clearly understood that it was necessary to present to the board the average implied rate for each of the contracts (assuming an exchange rate of 2,400 pesos per dollar) in order to be able to evaluate the effectiveness of the hedge globally, and not just focus the discussion on the loss in the forward market. Likewise, he had to take the available alternatives to the board, which after much thought redu- ced them to two: 1) leave the hedge as it was; or, 2) settle the positions with the current dollar at 2,400 pesos, assuming the present value of the losses or gains for each of the contracts. Both alternatives have advantages and disadvantages, and Hector knew that much depended on the expectations held regarding the evolution of the exchange rate for the next 16 months. Some directors were pessimistic about the Colombian economy, so they expected an even greater de- valuation that would bring the exchange rate to 3,000 pesos per dollar. Hector had received an email from a director with several exchange rate forecasts even two days earlier, where the con- sensus from those sources was a further devaluation of the peso to around 3,000 pesos per dollar. However, other directors set their expectations in the opposite direction. They argued that subs- tantial investments in infrastructure would make the country receive enough dollars to reverse the devaluation trend and that signs of a reversal in the exchange rate were already becoming evident. Therefore, in the next 16 months, they would not be surprised to see exchange rates nea- ring 1,700 pesos. Nevertheless, there was the issue of volume risk. Although trading with the parent company should not be entirely ruled out as part of the hedging strategy (e.g., varying dollar flows depending on exchange rate levels), the fact was that such trading would not be expedited, and decisions had to be taken immediately. Creating different exchange rate scenarios seemed indispensable to meet the two conflicting expec- tations of directors, but Hector knew he had to do it in the clearest possible terms. The discount rate to bring to the present the potential gains or losses of each scenario would be 10%. This was the average cost of capital for the company, and Hector foresaw a few days of hard work, especia- lly since David Johnson, president of C+S, requested a teleconference before the board meeting to get them both in line for a clear exchange of opinions regarding NDF contracts. EXHIBIT 1. Settled NDF contracts Contracts MTR (agreed) MTR (actl) 2,007.48 2,065-38 Notional value (US$) 4.3500,000 1 1,898.41 2 1,903.00 4,500,000 Profit / Lost (COP) (490,815,000.00) (730,710,000) (1,293,050,000) (615,690,000) (445,640,000) 3 2,165.15 1,906.54 5,000,000 4 2.346.90 1,936.44 1,500,000 5 2,386.28 1,940.64 1,000,000 (3,575.905,000) Notes: NDF signifies Non-Deliverable Forward The profits and losses are calculated as follows: (MTR Agreed - MTR actual) "Notional Value Source: contracts signed with Banco Mercantil (see Exhibit 3) EXHIBIT 2. Evolution of the COP exchange rate vs U.S.$ 2,500.00 2,400.00 2,300.00 am 2,200.00 2,100.00 2,000.00 1,900.00 1,800.00 1,700.00 1,700.00 11/2013 01/2014 03/2014 04/2014 06/2013 07/2014 09/2014 11/2014 12/2014 02/2014 04/2014 Source: Banco de la Repblica historical series (http://www.banrep.gov.co/es/tasa-cambio-del-peso-colombiano-trm) EXHIBIT 3.1,5 and 10-year zero coupon term rates* (Colombia) and t-Bill and t-Bonds rate (USA) Date 1 year 10 years t-Bills t-Bonds 5 years 6.63% 4-35% 7.63% 0.12% 2.86% 4.25% 6.62% 7.62% 0.12% 2.71% 31/01/14 28/02/14 31/03/14 30/04/14 4.14% 5.93% 6.77% 0.13% 2.72% 4-35% 6.03% 6.77% 0.11% 2.70% 30/05/14 4-53% 6.05% 6.63% 0.10% 2.56% 27/06/14 4.70% 6.24% 6.90% 0.10% 2.60% 31/07/14 4.77% 6.26% 6.97% 0.11% 2-55% 29/08/14 4.81% 5.99% 0.11% 2.42% 6.73% 7.21% 30/09/14 4.87% 6.21% 0.11% 2.53% 31/10/14 4.82% 5.90% 6.95% 0.10% 2.30% 4.66% 5.68% 6.97% 0.13% 2-33% 28/11/14 30/12/14 30/01/15 4.94% 6.31% 7-53% 0.21% 2.21% 4-53% 5.61% 6.99% 0.20% 1.88% 27/02/15 4-55% 5-54% 6.98% 0.22% 1.97% 4.84% 6.13% 7-42% 0.25% 2.04% 31/03/15 30/04/15 4.70% 5.88% 7.22% 0.23% 1.93% 29/05/15 4.68% 5.98% 7-37% 0.24% 2.20% 30/06/15 4.61% 6.32% 7.89% 0.28% 2.36% 4.64% 6.29% 7.78% 0-30% 2.32% 5.06% 6.89% 8.34% 0.38% 2.17% 31/07/15 31/08/15 30/09/15 30/10/15 5.64% 7-50% 8.63% 0.37% 2.17% 5-47% 7-37% 8.25% 0.26% 2.07% 30/11/15 6.20% 7.68% 8.71% 0.48% 2.26% 30/12/15 6.50% 7.94% 8.88% 0.65% 2.24% Source: SEN and MEC, with calculations from Banco de la Repblica and Federal Reserve Economic Data: https://fred.stlossfed.org * Zero coupon rates are calculated from information on market prices of TES in pesos, using Nelson & Siegel's model. EXHIBIT 4. Forward contracts signed Contract 1 Contract 2 Contract 3 Notional Value (8) 4.500,000 Notional Value (8) 4.500,000 Notional Value (8) 5,000,000 NDF rate 1,898.41 NDF rate 1.903.00 NDF rate 1.906.54 Start date 5/08/14 Start date 5/08/14 Start date 5/08/14 Due date 25/09/14 Due date 24/10/14 Due date 27/11/14 Contract 4 Contract 5 Contract 6 Notional Value ($) 1.500,000 National Value ($) 3323,000 Notional Value ($) 3.358,000 NDF rate 1.936.44 NDF rate 1.940.64 NDF rate 1.944-71 Start date 5/08/14 Start date 5/08/14 Start date 5/08/14 Due date 26/12/14 Due date 27/01/15 Due date 27/02/15 Contract 7 Contracts Contract 9 Notional Value (8) 3.466,000 National Value ($) 3.415,000 Notional Value ($) 3.422,000 NDF rate 1,948.40 1.952.49 NDF rate 1.956.46 Start date 5/08/14 Start date NDF rate Start date 5/08/14 Due date 27/03/15 Due date 27/04/15 Due date 27/05/15 Contract 10 Contract 11 Contract 12 Notional Value (8) 3.470,000 Notional Value ($) 3.474,000 National Value ($) 2,600,000 NDF rate 1,967.69 NDF rate 1.973.45 NDF rate 1.978.41 Start date 5/08/14 Start date 5/08/14 Start date 5/08/14 Due date 26/06/15 Due date 27/07/15 Due date 27/08/15 Contract 13 Contract 14 Contract 15 Notional Value () 2,411,000 National Value ($) 1,680,000 Notional Value () 2.955,000 NDF rate 1.983.54 NDF rate 1.988.20 NDF rate 1.993.20 Start date 5/08/14 Start date 5/08/14 Start date 5/08/14 Due date 26/09/15 Due date 27/10/15 Due date 30/11/15 EXHIBIT 4. Forward contracts signed Contract 16 Contract 17 Contract 18 Notional Value ($) 1,364,000 Notional Value ($) 1,680,000 Notional Value ($) 1,680,000 NDF rate 1.998.21 NDF rate 2,003.07 NDF rate 2,007.94 Start date 5/08/14 Start date 5/08/14 Start date 5/08/14 Due date 28/12/15 Due date 27/01/16 Due date 28/02/16 Contract 19 Contract 20 Contract 21 National Value ($) 1.364,000 Notional Value ($) 1,680,000 Notional Value ($) 1,129,000 NDF rate 2,012.99 NDF rate 2,017.89 NDF rate 2,022.80 Start date 5/08/14 Start date 5/08/14 Start date 5/08/14 Due date 29/03/16 Due date 27/04/16 Due date 27/05/17 Source: contracts signed by the company and Banco Mercantil EXHIBIT 5. Income Projection Income Est. Coverage % Coverage feb-15 5.745.688 3.358,000 58% mar-15 1,957,145 3.466.000 177% abr-15 3.179.725 3.415.000 107% may-15 3,416.521 3.422,000 100% jun-15 3.517,671 3.470,000 99% jul-15 3.359,235 3.474,000 103% aug-15 3.298,085 80% 2,600,000 2.411,000 sep-15 3.359,235 72% oct-15 5.909.235 1,680,000 28% nov-15 2,727,048 2,955,000 108% dec-15 3.359,235 1.364.000 41% jan-16 1,680,000 50% 3.359,235 2,727,048 feb-16 1,680,000 62% mar-16 3,359,235 1.364.000 41% abr-16 2.258,591 1,680,000 74% may-16 930,857 1,129,000 121% M N Assumptions Scenarios Peso/$ Appreciate 1700 Settle 2400 Depreciate 3000 CMGR -2.13% Appreciation Scenario Dates Contract # State Date Maturity Date NDF Rate ($) Contract Size (S) MRT at Time T (S) P/L (S) Cumulative P/L 1-Sep-14 1 8-May-14 25-Sep-14 1.898.41 4,500,000 2.400.00 (2,257,155,000.00) (2,257,155,000.00) 1-Oct-14 2 8-May-14 24-Oct-141 1.903.00 4.500.000 2.400.00 (2,236,500,000.00) (4,493,655,000.00) 1-Nov-14 3 8-May-14 27-Nov-14 1,906.54 5,000,000 2.400.00(2,467,300,000.00 6,960,955,000.00) 1-Dec-14 4 8-May-14 26-Dec-14 1.936.44 1.500.000 2.400.00 (695,340.000.00)| (7,656,295,000.00) 1-Jan-15 5 8-May-14 27-Jan-15 1.940.64 3,323.000 2.400.00 (1,526,453,280.00) 9,182,748,280.00) 1-Feb-15 6 8-May-14 27-Feb-151 1.944.71 3,358.000 2.348.83 (1,357,026,087.70) (10,539,774,367.70) 1-Mar-15 7 8-May-14 27-Mar-151 1.948.40 3.466.000 2,298.75 (1,214,298,596.28) (11,754,072,963.98) 1-Apr-15 8 8-May-14 27-Apr-151 1.952.49 3,415.000 2.249.73 (1,015.081,800.03) (12,769,154,764.01) 1-May-15 9 8-May-14 27-May-151 1.956.46 3.422.000 2.201.76 (839,428,468.58) (13,608,583,232.59) 1-Jun-15) 10 8-May-141 26-Jun-151 1.967.69 3,470,000 2.154.82 (649,332,815.26) (14,257,916,047.85) 1-Jul-15 11 8-May-14 27-Jul-151 1.973.45 3.474,000 2.108.87 (470,458,574.68) (14,728,374,622.52) 1-Aug-15 12 8-May-14 27-Aug-15 1.978.41 2.600,000 2,063.91 (222,293,467.15) (14,950,668,089.67) 1-Sep-15 13 8-May-14 26-Sep-151 1.983.54 2.411,000 2.019.90 (87.666,341.28) (15,038,334,430.95) 1-Oct-15 14 8-May-14 27-Oct-15 1.988.20 1.680.000 1.976.83 19.096.909.99 (15,019,237,520.96) 1-Nov-15 15 8-May-14 30-Nov-151 1.993.20 2,955,000 1,934.68 172.918.051.44 (14,846,319,469.52) 1-Dec-15 16 8-May-14 28-Dec-15 1.998.21 1,364,000 1.893.43 142.917.585.48 (14,703,401,884.04) 1-Jan-16 17 8-May-14 27-Jan-16 2.003.07 1.680.000 1.853.06 252.016,657.01 (14,451,385,227.04) 1-Feb-16 18 8-May-14 28-Feb-16 2.007.94 1.680,000 1.813.55 326,576.443.43 (14,124,808,783.61) 1-Mar-16 19 8-May-14 29-Mar-16 2,012.99 1,364,000 1,774.88 324,780.837.18 (13,800,027,946.43) 1-Apr-16 20 8-May-14 27-Apr-16 2.017.89 1.680.000 1.737.04 471.833,059.47 (13,328,194,886.96) 1-May-16 21 8-May-14 27-May-17 2.022.80 1.129.000 1.700.00 364.441,200.00 (12.963,753,686.96) CMGR 1.40% CMGR 0.00% Depprecation Scenario Settle Scenario MRT at Time T (S) P/L (S) Cumulative PL MRT at Time T ($) PL ($) Cumulative P/L 2.400.00 (2,257,155,000.00) (2,257,155,000.00) 2.400.00 (2,257,155,000.00) (2,257,155,000.00) 2.400.00 (2,236,500,000.00) (4,493,655,000.00) 2.400.00 (2.236,500,000.00) (4.493,655,000.00) 2.400.00 (2.467,300,000.00) (6.960,955,000.00) 2.400.00 (2.467,300,000.00)| (6,960,955,000.00) 2.400.00 (695,340,000.00) (7.656,295,000.00) 2,400.00 (695,340,000.00)| (7,656,295,000.00) 2.400.00 (1,526,453,280.00) (9.182,748,280.00) 2.400.00 (1.526,453,280.00) 9.182,748,280.00) 2.433.71 (1,642,048,656.80) (10.824,796,936.80) 2.400.00(1,528,863,820.00) (10.711,612,100.00) 2.467.89 (1,800,536,487.61) (12,625,333,424.41) 2.400.00 (1,565,245,600.00) (12.276.857,700.00) 2.502.54 (1.878,437,305.06 (14,503.770.729.48) 2.400.00 (1,528.246,650.00) (13.805,104,350.00) 2.537.69 (1.988.972.592.38) (16,492,743,321.86 2.400.00 (1,517,793,880.00)| (15,322,898,230.00) 2.573.33 (2.101,573,631.61) (18.594,316,953.47) 2.400.00 (1.500.115,700.00) (16.823,013,930.00) 2.609.47 (2,209,537,409.96) (20,803,854,363.43) 2.400.00 (1,481,834,700.00) (18,304,848,630.00) 2.646.12(1.736,043,419.45) (22,539,897,782.88) 2.400.00 (1,096,134,000.00) (19,400,982,630.00) 2.683.28(1,687,076,932.50)| (24,226,974.715.38) 2.400.00 (1,004,085,060.00) (20,405,067,690.00) 2.720.97 (1.231,046,974.40)(25,458,021,689.78) 2,400.00 (691,824,000.00)| (21,096,891,690.00) 2.759.18 (2,263,470,270.47)| (27,721,491.960.25) 2.400.00 (1,202,094,000.00) (22,298,985,690.00) 2.797.93 (1,090,818,350.28) (28,812,310,310.54) 2,400.00 (548,041,560.00) (22,847,027,250.00) 2.837.22(1,401,380.109.38) (30,213,690,419.91) 2.400.00 (666,842,400.00) (23,513,869,650.00) 2.877.07 (1,460.140,611.91) (31,673,831,031.82) 2.400.00 (658,660,800.00) (24,172,530,450.00) 2.917.48 (1,233,720,837.33) (32,907,551.869.15) 2,400.00 (527,881,640.00) (24,700,412,090.00) 2.958.45(1,580.142.460.92) (34,487,694,330.07) 2.400.00 (641,944,800.00) (25,342,356,890.00) 3,000.00 (1,103,258,800.00) (35,590,953,130.07) 2.400.00 (425,858,800.00)|(25,768,215,690.00)


