Explain how do you do the Frequencies as I was not able to understand it, thank you (Correct answers already there, Use Excel). (Right-click "Open image in new Tab" to be able to see the picture better).
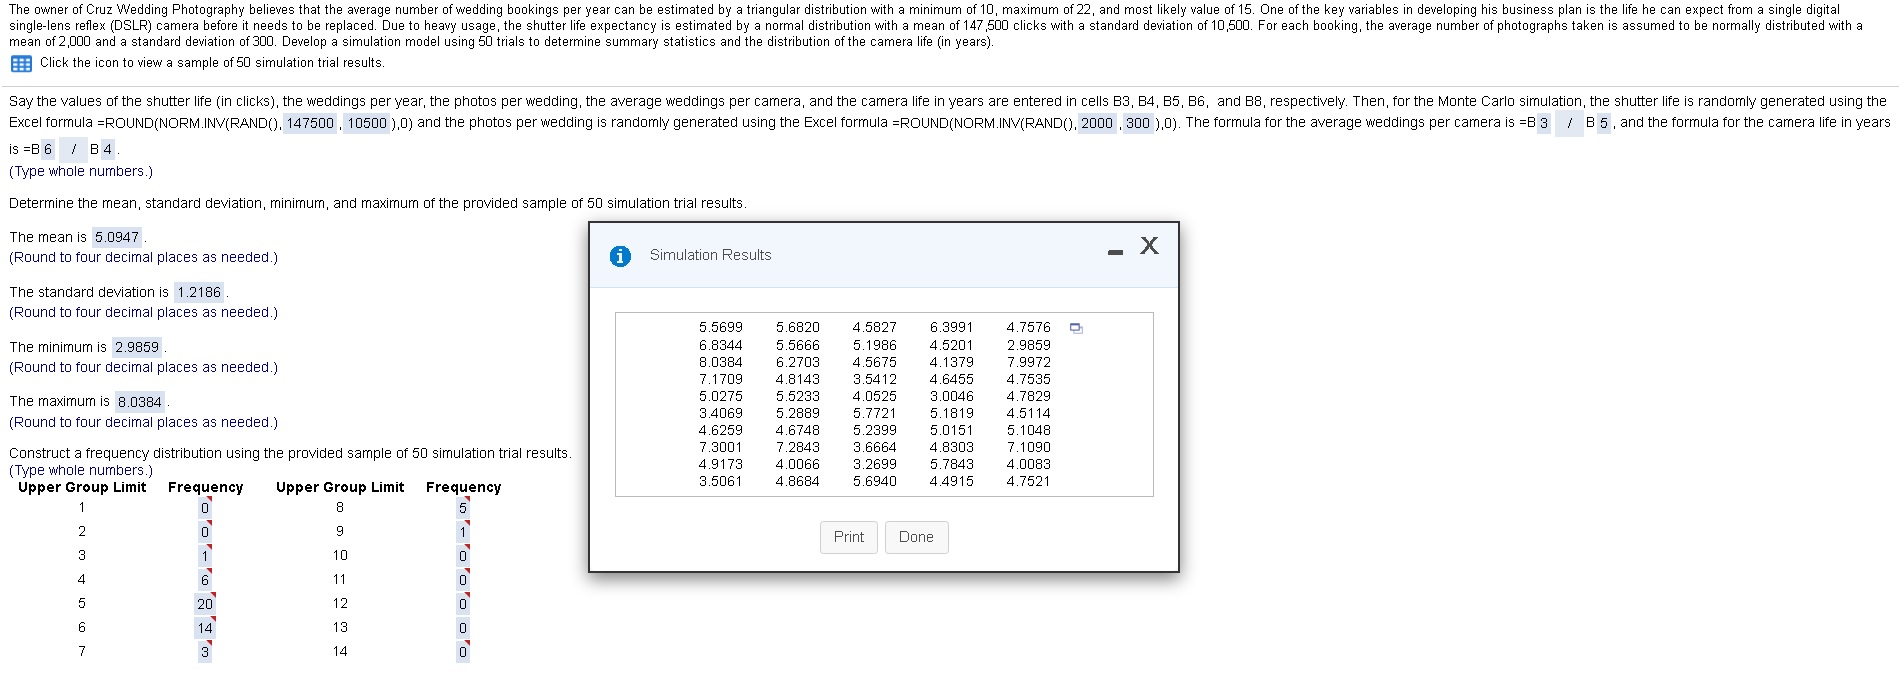
The owner of Cruz Wedding Photography believes that the average number of wedding bookings per year can be estimated by a triangular distribution with a minimum of 10, maximum of 22, and most likely value of 15. One of the key variables in developing his business plan is the life he can expect from a single digital single-lens reflex (DSLR) camera before it needs to be replaced. Due to heavy usage, the shutter life expectancy is estimated by a normal distribution with a mean of 147 ,500 clicks with a standard deviation of 10,500. For each booking, the average number of photographs taken is assumed to be normally distributed with a mean of 2,000 and a standard deviation of 300. Develop a simulation model using 50 trials to determine summary statistics and the distribution of the camera life (in years). Click the icon to view a sample of 50 simulation trial results. Say the values of the shutter life (in clicks), the weddings per year, the photos per wedding, the average weddings per camera, and the camera life in years are entered in cells B3, B4, B5, B6, and BB, respectively. Then, for the Monte Carlo simulation, the shutter life is randomly generated using the Excel formula =ROUND(NORM.INV(RAND(), 147500 , 10500 ),0) and the photos per wedding is randomly generated using the Excel formula =ROUND(NORM.INV(RAND(). 2000 , 300 ).0). The formula for the average weddings per camera is =B 3 / B 5 , and the formula for the camera life in years is =8 6 / 64 (Type whole numbers.) Determine the mean, standard deviation, minimum, and maximum of the provided sample of 50 simulation trial results The mean is 5.0947 . i Simulation Results - X (Round to four decimal places as needed.) The standard deviation is 1.2186 (Round to four decimal places as needed. ) 5.5699 5.6820 4.5827 6.3991 4.7576 The minimum is 2.9859 6.8344 5.5666 5.1986 4.5201 2.9859 (Round to four decimal places as needed.) 8.0384 6.2703 4.5675 4.1379 7.9972 7.1709 4.8143 3.5412 4.6455 4.7535 The maximum is 8.0384. 5.0275 5.5233 4.0525 3.0046 4.7829 3.4069 5.2889 5.7721 5.1819 4.5114 (Round to four decimal places as needed.) 4.6259 4.6748 5.2399 5.0151 5.1048 7.3001 3.6664 4.8303 7.1090 Construct a frequency distribution using the provided sample of 50 simulation trial results. 7.2843 (Type whole numbers.) 4.9173 4.0066 3.2695 5.7843 4.0083 Upper Group Limit Frequency Upper Group Limit Frequency 3.5061 4.8684 5.6940 4.4915 4.7521 8 Print Done 14