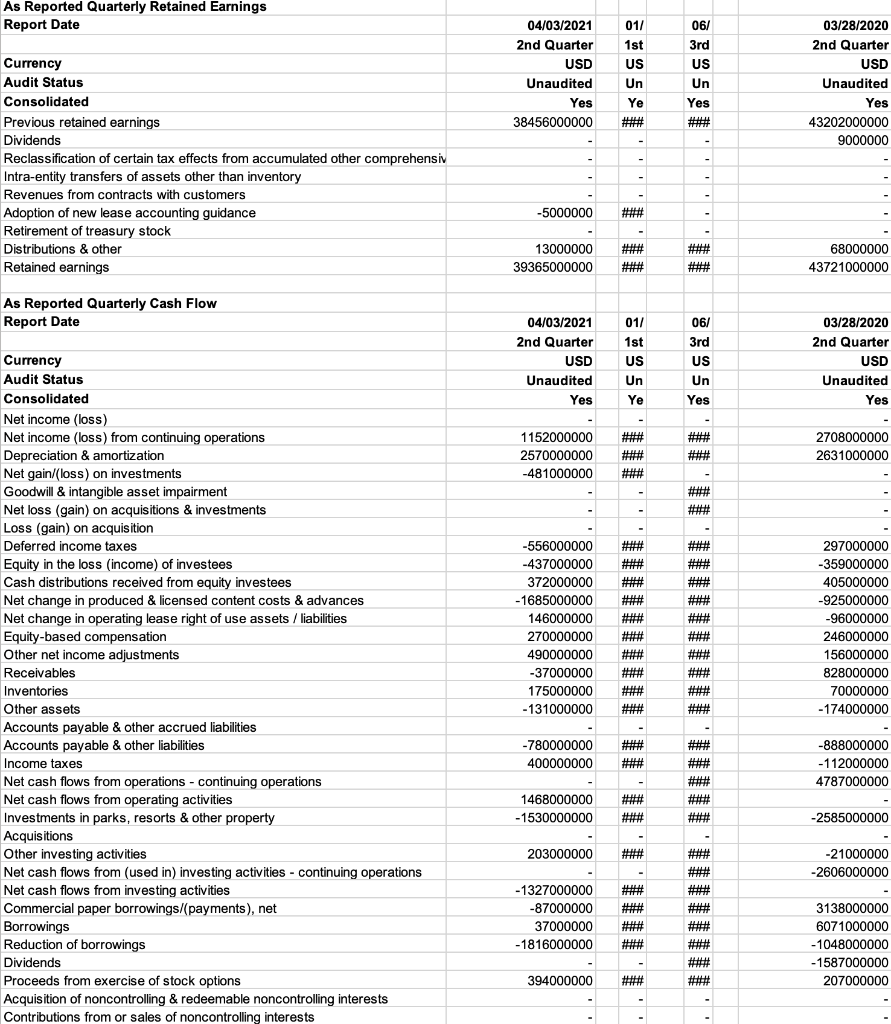
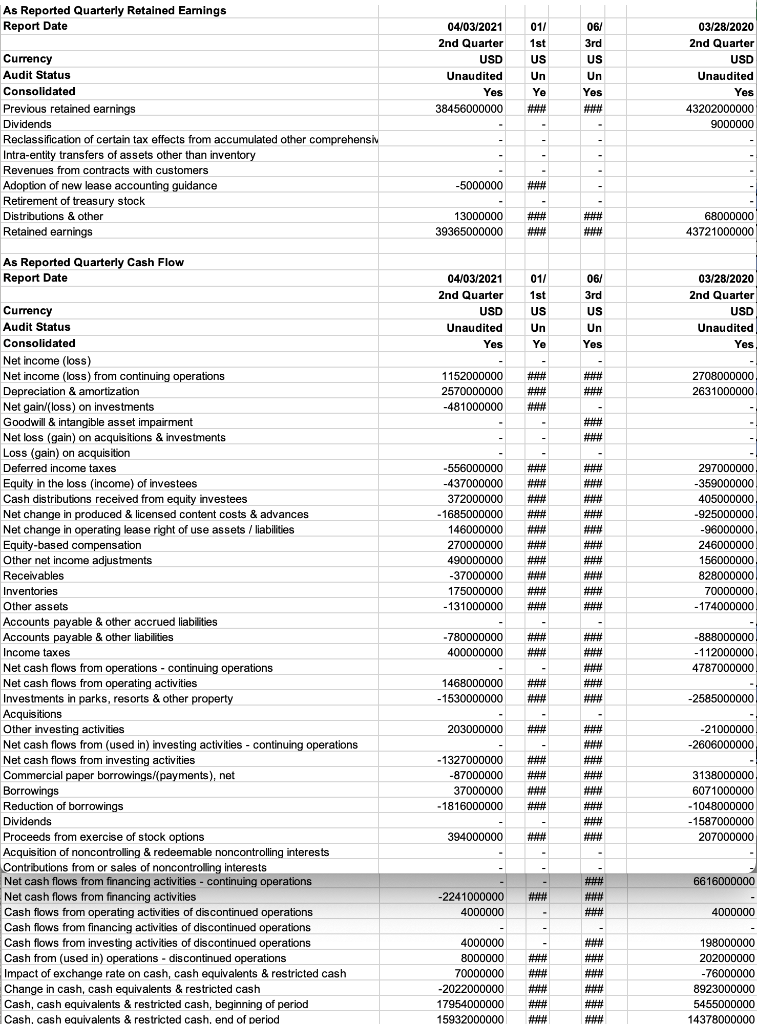
Explain how potential short-term financing sources could help Disney, Inc. raise needed funds to improve its financial health. Base your response on the businesss current financial information.


As Reported Quarterly Retained Earnings Report Date 04/03/2021 011 06/ 03/28/2020 2nd Quarter 1st 3rd 2nd Quarter USD US US USD Currency Audit Status Unaudited Un Un Unaudited Consolidated Yes Ye Yes Yes 38456000000 ### 43202000000 9000000 Previous retained earnings Dividends Reclassification of certain tax effects from accumulated other comprehensiv Intra-entity transfers of assets other than inventory Revenues from contracts with customers - -5000000 ### Adoption of new lease accounting guidance Retirement of treasury stock Distributions & other 13000000 WE ATTIT 68000000 Retained earnings 39365000000 ### 43721000000 As Reported Quarterly Cash Flow Report Date 04/03/2021 01/ 06/ 03/28/2020 2nd Quarter 1st 3rd 2nd Quarter USD US US USD Currency Audit Status Unaudited Un Un Unaudited Consolidated Yes Ye Yes Yes 1152000000 2708000000 2631000000 2570000000 HHH ### -481000000 ### #t ### Net income (loss) Net income (loss) from continuing operations Depreciation & amortization Net gain/(loss) on investments Goodwill & intangible asset impairment Net loss (gain) on acquisitions & investments Loss (gain) on acquisition Deferred income taxes Equity in the loss (income) of investees Cash distributions received from equity investees Net change in produced & licensed content costs & advances Net change in operating lease right of use assets / liabilities Equity-based compensation Other net income adjustments Receivables ### #*** -556000000 -437000000 372000000 - 1685000000 146000000 297000000 -359000000 405000000 ### -925000000 ### ### -96000000 270000000 246000000 490000000 ### ### 156000000 -37000000 ### 828000000 175000000 ### 70000000 -174000000 -131000000 ### if it -780000000 ### ### 400000000 ### -888000000 - 112000000 4787000000 1468000000 ### ### ### -1530000000 ### -2585000000 Inventories Other assets Accounts payable & other accrued liabilities Accounts payable & other liabilities Income taxes Net cash flows from operations - continuing operations Net cash flows from operating activities Investments in parks, resorts & other property Acquisitions Other investing activities Net cash flows from (used in) investing activities - continuing operations Net cash flows from investing activities Commercial paper borrowings/(payments), net Borrowings Reduction of borrowings Dividends Proceeds from exercise of stock options Acquisition of noncontrolling & redeemable noncontrolling interests Contributions from or sales of noncontrolling interests 203000000 ### -21000000 -2606000000 -1327000000 ### -87000000 ### ### 3138000000 37000000 ### ### 6071000000 -1816000000 ### ### -1048000000 - 1587000000 207000000 394000000 As Reported Quarterly Retained Earnings Report Date 04/03/2021 01/ 06/ 03/28/2020 1st 3rd 2nd Quarter 2nd Quarter USD US US USD Unaudited Un Un Unaudited Yes Yes Ye Yes 38456000000 ### #** 43202000000 9000000 Currency Audit Status Consolidated Previous retained earnings Dividends Reclassification of certain tax effects from accumulated other comprehensiv Intra-entity transfers of assets other than inventory Revenues from contracts with customers Adoption of new lease accounting guidance Retirement of treasury stock Distributions & other Retained earnings -5000000 HE HT HH THE 68000000 13000000 39365000000 ### ### 43721000000 As Reported Quarterly Cash Flow Report Date 01/ 06/ 03/28/2020 04/03/2021 2nd Quarter USD 1st 3rd 2nd Quarter US US USD Currency Audit Status Unaudited Un Un Unaudited Consolidated Yes Ye Yes Yes ALLAH MHR 1152000000 2570000000 -481000000 2708000000 2631000000 ### ### ### HH HA #*** -556000000 HE HAT TH HAT -437000000 HU HI ri 297000000 -359000000 405000000 -925000000 372000000 ### APP HT ### ### ### -96000000 ### ### ### 246000000 -1685000000 0.000000 146000000 270000000 490000000 -37000000 175000000 -131000000 ### HH 156000000 # ### 828000000 ### ### 70000000 ### HT - 174000000 -780000000 ### 400000000 ### HI -888000000 - 112000000 4787000000 ### 1468000000 ### ### Net income (loss) Net income (loss) from continuing operations Depreciation & amortization Net gain (loss) on investments Goodwill & intangible asset impairment Net loss (gain) on acquisitions & investments Loss (gain) on acquisition Deferred income taxes Equity in the loss (income) of investees Cash distributions received from equity investees Net change in produced & licensed content costs & advances Net change in operating lease right of use assets / liabilities Equity-based compensation Other net income adjustments Boccus Receivables Invento Inventories Oth Other assets Accounts payable & other accrued liabilities Accounts payable & other liabilities Income taxes Net cash flows from operations - continuing operations Net cash flows from operating activities Investments in parks, resorts & other property Acquisitions Other investing activities Net cash flows from (used in) investing activities - continuing operations Net cash flows from investing activities Commercial paper borrowings/payments), net Borrowings Reduction of borrowings Dividends Proceeds from exercise of stock options Acquisition of noncontrolling & redeemable noncontrolling interests Contributions from or sales of noncontrolling interests Net cash flows from financing activities - continuing operations Net cash flows from financing activities Cash flows from operating activities of discontinued operations Cash flows from financing activities of discontinued operations Cash flows from investing activities of discontinued operations Cash from (used in) operations - discontinued operations Impact of exchange rate on cash, cash equivalents & restricted cash Change in cash, cash equivalents & restricted cash Cash, cash equivalents & restricted cash, beginning of period Cash, cash equivalents & restricted cash, end of period - 1530000000 ### #*** -2585000000 203000000 ### TH AT IT -21000000 -2606000000 -1327000000 ### #*** ### ## w #* ### -87000000 37000000 -1816000000 3138000000 6071000000 ### HAH -1048000000 THE - 1587000000 394000000 #*** 207000000 6616000000 -2241000000 4000000 4000000 ### 198000000 4000000 8000000 ### ### 202000000 70000000 -76000000 ### ### ### ### -2022000000 8923000000 17954000000 ### ### 5455000000 14378000000 15932000000 ### ### As Reported Quarterly Retained Earnings Report Date 04/03/2021 011 06/ 03/28/2020 2nd Quarter 1st 3rd 2nd Quarter USD US US USD Currency Audit Status Unaudited Un Un Unaudited Consolidated Yes Ye Yes Yes 38456000000 ### 43202000000 9000000 Previous retained earnings Dividends Reclassification of certain tax effects from accumulated other comprehensiv Intra-entity transfers of assets other than inventory Revenues from contracts with customers - -5000000 ### Adoption of new lease accounting guidance Retirement of treasury stock Distributions & other 13000000 WE ATTIT 68000000 Retained earnings 39365000000 ### 43721000000 As Reported Quarterly Cash Flow Report Date 04/03/2021 01/ 06/ 03/28/2020 2nd Quarter 1st 3rd 2nd Quarter USD US US USD Currency Audit Status Unaudited Un Un Unaudited Consolidated Yes Ye Yes Yes 1152000000 2708000000 2631000000 2570000000 HHH ### -481000000 ### #t ### Net income (loss) Net income (loss) from continuing operations Depreciation & amortization Net gain/(loss) on investments Goodwill & intangible asset impairment Net loss (gain) on acquisitions & investments Loss (gain) on acquisition Deferred income taxes Equity in the loss (income) of investees Cash distributions received from equity investees Net change in produced & licensed content costs & advances Net change in operating lease right of use assets / liabilities Equity-based compensation Other net income adjustments Receivables ### #*** -556000000 -437000000 372000000 - 1685000000 146000000 297000000 -359000000 405000000 ### -925000000 ### ### -96000000 270000000 246000000 490000000 ### ### 156000000 -37000000 ### 828000000 175000000 ### 70000000 -174000000 -131000000 ### if it -780000000 ### ### 400000000 ### -888000000 - 112000000 4787000000 1468000000 ### ### ### -1530000000 ### -2585000000 Inventories Other assets Accounts payable & other accrued liabilities Accounts payable & other liabilities Income taxes Net cash flows from operations - continuing operations Net cash flows from operating activities Investments in parks, resorts & other property Acquisitions Other investing activities Net cash flows from (used in) investing activities - continuing operations Net cash flows from investing activities Commercial paper borrowings/(payments), net Borrowings Reduction of borrowings Dividends Proceeds from exercise of stock options Acquisition of noncontrolling & redeemable noncontrolling interests Contributions from or sales of noncontrolling interests 203000000 ### -21000000 -2606000000 -1327000000 ### -87000000 ### ### 3138000000 37000000 ### ### 6071000000 -1816000000 ### ### -1048000000 - 1587000000 207000000 394000000 As Reported Quarterly Retained Earnings Report Date 04/03/2021 01/ 06/ 03/28/2020 1st 3rd 2nd Quarter 2nd Quarter USD US US USD Unaudited Un Un Unaudited Yes Yes Ye Yes 38456000000 ### #** 43202000000 9000000 Currency Audit Status Consolidated Previous retained earnings Dividends Reclassification of certain tax effects from accumulated other comprehensiv Intra-entity transfers of assets other than inventory Revenues from contracts with customers Adoption of new lease accounting guidance Retirement of treasury stock Distributions & other Retained earnings -5000000 HE HT HH THE 68000000 13000000 39365000000 ### ### 43721000000 As Reported Quarterly Cash Flow Report Date 01/ 06/ 03/28/2020 04/03/2021 2nd Quarter USD 1st 3rd 2nd Quarter US US USD Currency Audit Status Unaudited Un Un Unaudited Consolidated Yes Ye Yes Yes ALLAH MHR 1152000000 2570000000 -481000000 2708000000 2631000000 ### ### ### HH HA #*** -556000000 HE HAT TH HAT -437000000 HU HI ri 297000000 -359000000 405000000 -925000000 372000000 ### APP HT ### ### ### -96000000 ### ### ### 246000000 -1685000000 0.000000 146000000 270000000 490000000 -37000000 175000000 -131000000 ### HH 156000000 # ### 828000000 ### ### 70000000 ### HT - 174000000 -780000000 ### 400000000 ### HI -888000000 - 112000000 4787000000 ### 1468000000 ### ### Net income (loss) Net income (loss) from continuing operations Depreciation & amortization Net gain (loss) on investments Goodwill & intangible asset impairment Net loss (gain) on acquisitions & investments Loss (gain) on acquisition Deferred income taxes Equity in the loss (income) of investees Cash distributions received from equity investees Net change in produced & licensed content costs & advances Net change in operating lease right of use assets / liabilities Equity-based compensation Other net income adjustments Boccus Receivables Invento Inventories Oth Other assets Accounts payable & other accrued liabilities Accounts payable & other liabilities Income taxes Net cash flows from operations - continuing operations Net cash flows from operating activities Investments in parks, resorts & other property Acquisitions Other investing activities Net cash flows from (used in) investing activities - continuing operations Net cash flows from investing activities Commercial paper borrowings/payments), net Borrowings Reduction of borrowings Dividends Proceeds from exercise of stock options Acquisition of noncontrolling & redeemable noncontrolling interests Contributions from or sales of noncontrolling interests Net cash flows from financing activities - continuing operations Net cash flows from financing activities Cash flows from operating activities of discontinued operations Cash flows from financing activities of discontinued operations Cash flows from investing activities of discontinued operations Cash from (used in) operations - discontinued operations Impact of exchange rate on cash, cash equivalents & restricted cash Change in cash, cash equivalents & restricted cash Cash, cash equivalents & restricted cash, beginning of period Cash, cash equivalents & restricted cash, end of period - 1530000000 ### #*** -2585000000 203000000 ### TH AT IT -21000000 -2606000000 -1327000000 ### #*** ### ## w #* ### -87000000 37000000 -1816000000 3138000000 6071000000 ### HAH -1048000000 THE - 1587000000 394000000 #*** 207000000 6616000000 -2241000000 4000000 4000000 ### 198000000 4000000 8000000 ### ### 202000000 70000000 -76000000 ### ### ### ### -2022000000 8923000000 17954000000 ### ### 5455000000 14378000000 15932000000 ### ###


