

Answered step by step
Verified Expert Solution
Question
1 Approved Answer
Explain in depth the graphical relationship between price and yield to maturity. 1500 1400 1300 1200 1100 1000 900 800 700 600 | 0% 2%
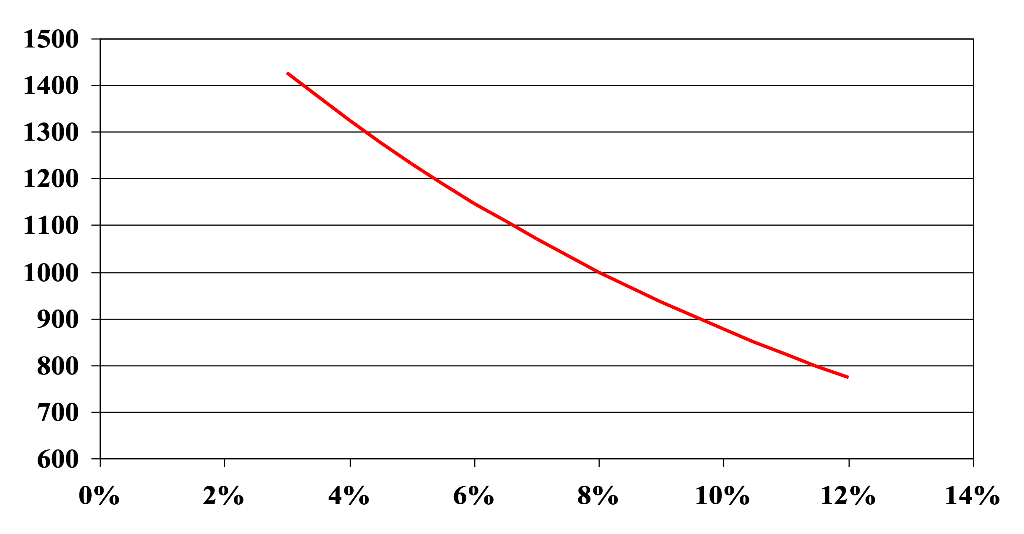
Explain in depth the graphical relationship between price and yield to maturity.
1500 1400 1300 1200 1100 1000 900 800 700 600 | 0% 2% 4% 6% 8% 10% 12% 14%Step by Step Solution
There are 3 Steps involved in it
Step: 1

Get Instant Access to Expert-Tailored Solutions
See step-by-step solutions with expert insights and AI powered tools for academic success
Step: 2

Step: 3
Ace Your Homework with AI
Get the answers you need in no time with our AI-driven, step-by-step assistance
Get Started
Financial Times Guide To The Financial Markets
Authors: Glen Arnold
1st Edition
0273730002, 978-0273730002