

Answered step by step
Verified Expert Solution
Question
1 Approved Answer
Explain operating expenses for 2020 and 2021 in comparison, and what it might be due to? Operating Activities Fiscal year is January-December. All values USD.
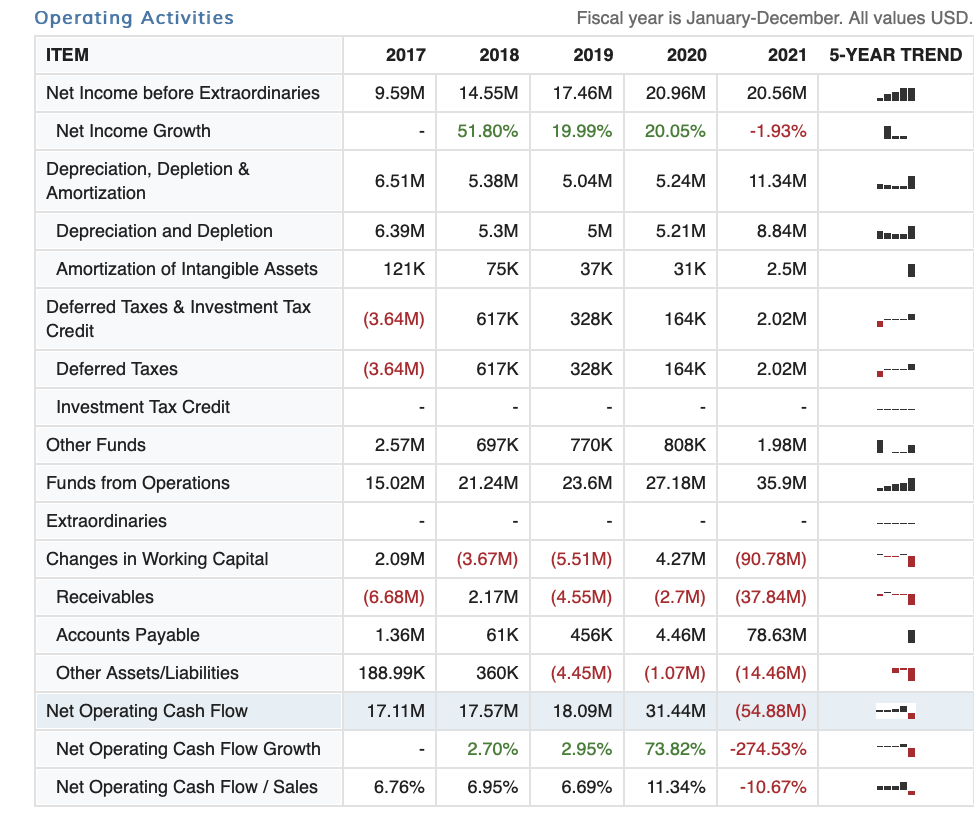
Explain operating expenses for 2020 and 2021 in comparison, and what it might be due to?
Operating Activities Fiscal year is January-December. All values USD. ITEM 2017 2018 2019 2020 2021 5-YEAR TREND Net Income before Extraordinaries 9.59M 14.55M 17.46M 20.96M 20.56M Net Income Growth 51.80% 19.99% 20.05% -1.93% L. Depreciation, Depletion & Amortization 6.51M 5.38M 5.04M 5.24M 11.34M 11 Depreciation and Depletion 6.39M 5.3M 5M 5.21M 8.84M Amortization of Intangible Assets 121K 75K 37K 31K 2.5M - Deferred Taxes & Investment Tax Credit (3.64M) 617K 328K 164K 2.02M 1 Deferred Taxes (3.64M) 617K 328K 164K 2.02M Investment Tax Credit Other Funds 2.57M 697K 770K 808K 1.98M 1 LI Funds from Operations 15.02M 21.24M 23.6M 27.18M 35.9M Extraordinaries ---- Changes in Working Capital 2.09M (3.67M) (5.51M) 4.27M (90.78M) 1 Receivables (6.68M) 2.17M (4.55M) (2.7M) (37.84M) 1 Accounts Payable 1.36M 61K 456K 4.46M 78.63M 1 Other Assets/Liabilities 188.99K 360K (4.45M) (1.07M) (14.46M) Net Operating Cash Flow 17.11M 17.57M 18.09M 31.44M (54.88M) Net Operating Cash Flow Growth 2.70% 2.95% 73.82% -274.53% --- Net Operating Cash Flow / Sales 6.76% 6.95% 6.69% 11.34% -10.67% Operating Activities Fiscal year is January-December. All values USD. ITEM 2017 2018 2019 2020 2021 5-YEAR TREND Net Income before Extraordinaries 9.59M 14.55M 17.46M 20.96M 20.56M Net Income Growth 51.80% 19.99% 20.05% -1.93% L. Depreciation, Depletion & Amortization 6.51M 5.38M 5.04M 5.24M 11.34M 11 Depreciation and Depletion 6.39M 5.3M 5M 5.21M 8.84M Amortization of Intangible Assets 121K 75K 37K 31K 2.5M - Deferred Taxes & Investment Tax Credit (3.64M) 617K 328K 164K 2.02M 1 Deferred Taxes (3.64M) 617K 328K 164K 2.02M Investment Tax Credit Other Funds 2.57M 697K 770K 808K 1.98M 1 LI Funds from Operations 15.02M 21.24M 23.6M 27.18M 35.9M Extraordinaries ---- Changes in Working Capital 2.09M (3.67M) (5.51M) 4.27M (90.78M) 1 Receivables (6.68M) 2.17M (4.55M) (2.7M) (37.84M) 1 Accounts Payable 1.36M 61K 456K 4.46M 78.63M 1 Other Assets/Liabilities 188.99K 360K (4.45M) (1.07M) (14.46M) Net Operating Cash Flow 17.11M 17.57M 18.09M 31.44M (54.88M) Net Operating Cash Flow Growth 2.70% 2.95% 73.82% -274.53% --- Net Operating Cash Flow / Sales 6.76% 6.95% 6.69% 11.34% -10.67%Step by Step Solution
There are 3 Steps involved in it
Step: 1

Get Instant Access to Expert-Tailored Solutions
See step-by-step solutions with expert insights and AI powered tools for academic success
Step: 2

Step: 3
Ace Your Homework with AI
Get the answers you need in no time with our AI-driven, step-by-step assistance
Get Started
Solutions Manual To Accompany Fundamentals Of Corporate Finance
Authors: Richard Brealey
6th Edition
0077265963, 978-0077265960