Answered step by step
Verified Expert Solution
Question
1 Approved Answer
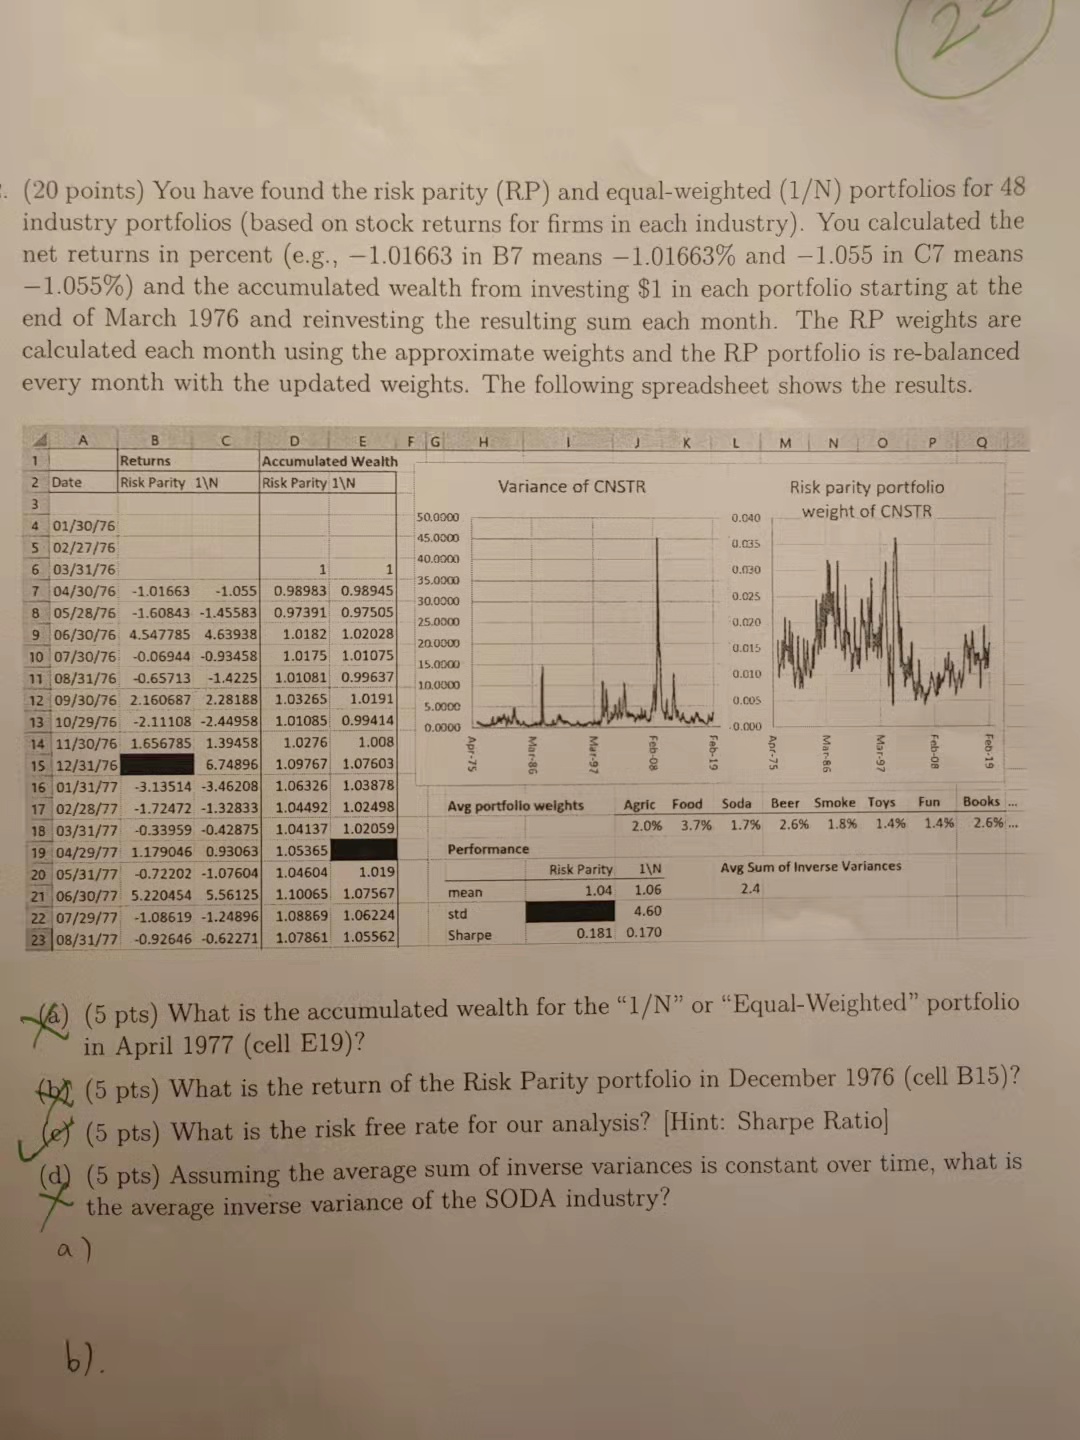
Explain question b please . (20 points) You have found the risk parity (RP) and equal-weighted (1/N) portfolios for 48 industry portfolios (based on stock

Explain question b please
. (20 points) You have found the risk parity (RP) and equal-weighted (1/N) portfolios for 48 industry portfolios (based on stock returns for firms in each industry). You calculated the net returns in percent (e.g., -1.01663 in B7 means -1.01663% and 1.055 in C7 means -1.055%) and the accumulated wealth from investing $1 in each portfolio starting at the end of March 1976 and reinvesting the resulting sum each month. The RP weights are calculated each month using the approximate weights and the RP portfolio is re-balanced every month with the updated weights. The following spreadsheet shows the results. F G H K L M NOP Q 4 1 2 Date B Returns Risk Parity 1\N D E Accumulated Wealth Risk Parity 1\N Variance of CNSTR 3 Risk parity portfolio weight of CNSTR 50.0000 0.040 45.0000 0.035 40.0000 0.030 35.0000 30,0000 0.023 25.0000 0.020 20.0000 0.015 0.010 15.0000 10.0000 5.0000 Lastenhuollon 0.005 0.0000 .0.000 4 01/30/76 5 02/27/76 6 03/31/76 1 7 04/30/76 -1.01663 -1.055 0.98983 0.98945 8 05/28/76 -1.60843 -1.45583 0.97391 0.97505 9 06/30/76 4.547785 4.63938 1.0182 1.02028 10 07/30/76 -0.06944 -0.93458 1.0175 1.01075 11 08/31/76 -0.65713 -1.4225 1.01081 0.99637 12 09/30/76 2.160687 2.28188 1.03265 1.0191 13 10/29/76 -2.11108 -2.44958 1.01085 0.99414 14 11/30/76 1.656785 1.39458 1.0276 1.008 15 12/31/76 6.74896 1.09767 1.07603 16 01/31/77 3.13514 -3.46208 1.06326 1.03878 17 02/28/77 -1.72472 -1.32833 1.04492 1.02498 18 03/31/77 -0.33959 -0.42875 1.04137 1.02059 19 04/29/77 1.179046 0.93063 1.05365 20 05/31/77 -0.72202 -1.07604 1.04604 1.019 21 06/30/77 5.220454 5.56125 1.10065 1.07567 22 07/29/77 -1.08619 -1.24896 1.08869 1.06224 23 08/31/77 -0.92646 -0.62271 1.07861 1.05562 3 Mar 86 Mar-97 Feb-08 Mar-se Fun Avg portfolio weights Agric Food 2.0% 3.7% Soda Beer Smoke Toys 1.7% 2.6% 1.8% 1.4% Books .. 2.6% ... 1.4% Performance Avg Sum of Inverse Variances 2.4 mean Risk Parity 1\N 1.04 1.06 4.60 0.181 0.170 std Sharpe (6) (5 pts) What is the accumulated wealth for the l/N or Equal-Weighted portfolio in April 1977 (cell E19)? (5 pts) What is the return of the Risk Parity portfolio in December 1976 (cell B15)? Let (5 pts) What is the risk free rate for our analysis? (Hint: Sharpe Ratio) (5 pts) Assuming the average sum of inverse variances is constant over time, what is the average inverse variance of the SODA industry? a) b) . (20 points) You have found the risk parity (RP) and equal-weighted (1/N) portfolios for 48 industry portfolios (based on stock returns for firms in each industry). You calculated the net returns in percent (e.g., -1.01663 in B7 means -1.01663% and 1.055 in C7 means -1.055%) and the accumulated wealth from investing $1 in each portfolio starting at the end of March 1976 and reinvesting the resulting sum each month. The RP weights are calculated each month using the approximate weights and the RP portfolio is re-balanced every month with the updated weights. The following spreadsheet shows the results. F G H K L M NOP Q 4 1 2 Date B Returns Risk Parity 1\N D E Accumulated Wealth Risk Parity 1\N Variance of CNSTR 3 Risk parity portfolio weight of CNSTR 50.0000 0.040 45.0000 0.035 40.0000 0.030 35.0000 30,0000 0.023 25.0000 0.020 20.0000 0.015 0.010 15.0000 10.0000 5.0000 Lastenhuollon 0.005 0.0000 .0.000 4 01/30/76 5 02/27/76 6 03/31/76 1 7 04/30/76 -1.01663 -1.055 0.98983 0.98945 8 05/28/76 -1.60843 -1.45583 0.97391 0.97505 9 06/30/76 4.547785 4.63938 1.0182 1.02028 10 07/30/76 -0.06944 -0.93458 1.0175 1.01075 11 08/31/76 -0.65713 -1.4225 1.01081 0.99637 12 09/30/76 2.160687 2.28188 1.03265 1.0191 13 10/29/76 -2.11108 -2.44958 1.01085 0.99414 14 11/30/76 1.656785 1.39458 1.0276 1.008 15 12/31/76 6.74896 1.09767 1.07603 16 01/31/77 3.13514 -3.46208 1.06326 1.03878 17 02/28/77 -1.72472 -1.32833 1.04492 1.02498 18 03/31/77 -0.33959 -0.42875 1.04137 1.02059 19 04/29/77 1.179046 0.93063 1.05365 20 05/31/77 -0.72202 -1.07604 1.04604 1.019 21 06/30/77 5.220454 5.56125 1.10065 1.07567 22 07/29/77 -1.08619 -1.24896 1.08869 1.06224 23 08/31/77 -0.92646 -0.62271 1.07861 1.05562 3 Mar 86 Mar-97 Feb-08 Mar-se Fun Avg portfolio weights Agric Food 2.0% 3.7% Soda Beer Smoke Toys 1.7% 2.6% 1.8% 1.4% Books .. 2.6% ... 1.4% Performance Avg Sum of Inverse Variances 2.4 mean Risk Parity 1\N 1.04 1.06 4.60 0.181 0.170 std Sharpe (6) (5 pts) What is the accumulated wealth for the l/N or Equal-Weighted portfolio in April 1977 (cell E19)? (5 pts) What is the return of the Risk Parity portfolio in December 1976 (cell B15)? Let (5 pts) What is the risk free rate for our analysis? (Hint: Sharpe Ratio) (5 pts) Assuming the average sum of inverse variances is constant over time, what is the average inverse variance of the SODA industry? a) b)Step by Step Solution
There are 3 Steps involved in it
Step: 1

Get Instant Access to Expert-Tailored Solutions
See step-by-step solutions with expert insights and AI powered tools for academic success
Step: 2

Step: 3

Ace Your Homework with AI
Get the answers you need in no time with our AI-driven, step-by-step assistance
Get Started


