

Question: Explain step by step but don't use excel 28) The following is a list of GPA ranges and frequencies from a high school. Use 1.5
Explain step by step but don't use excel
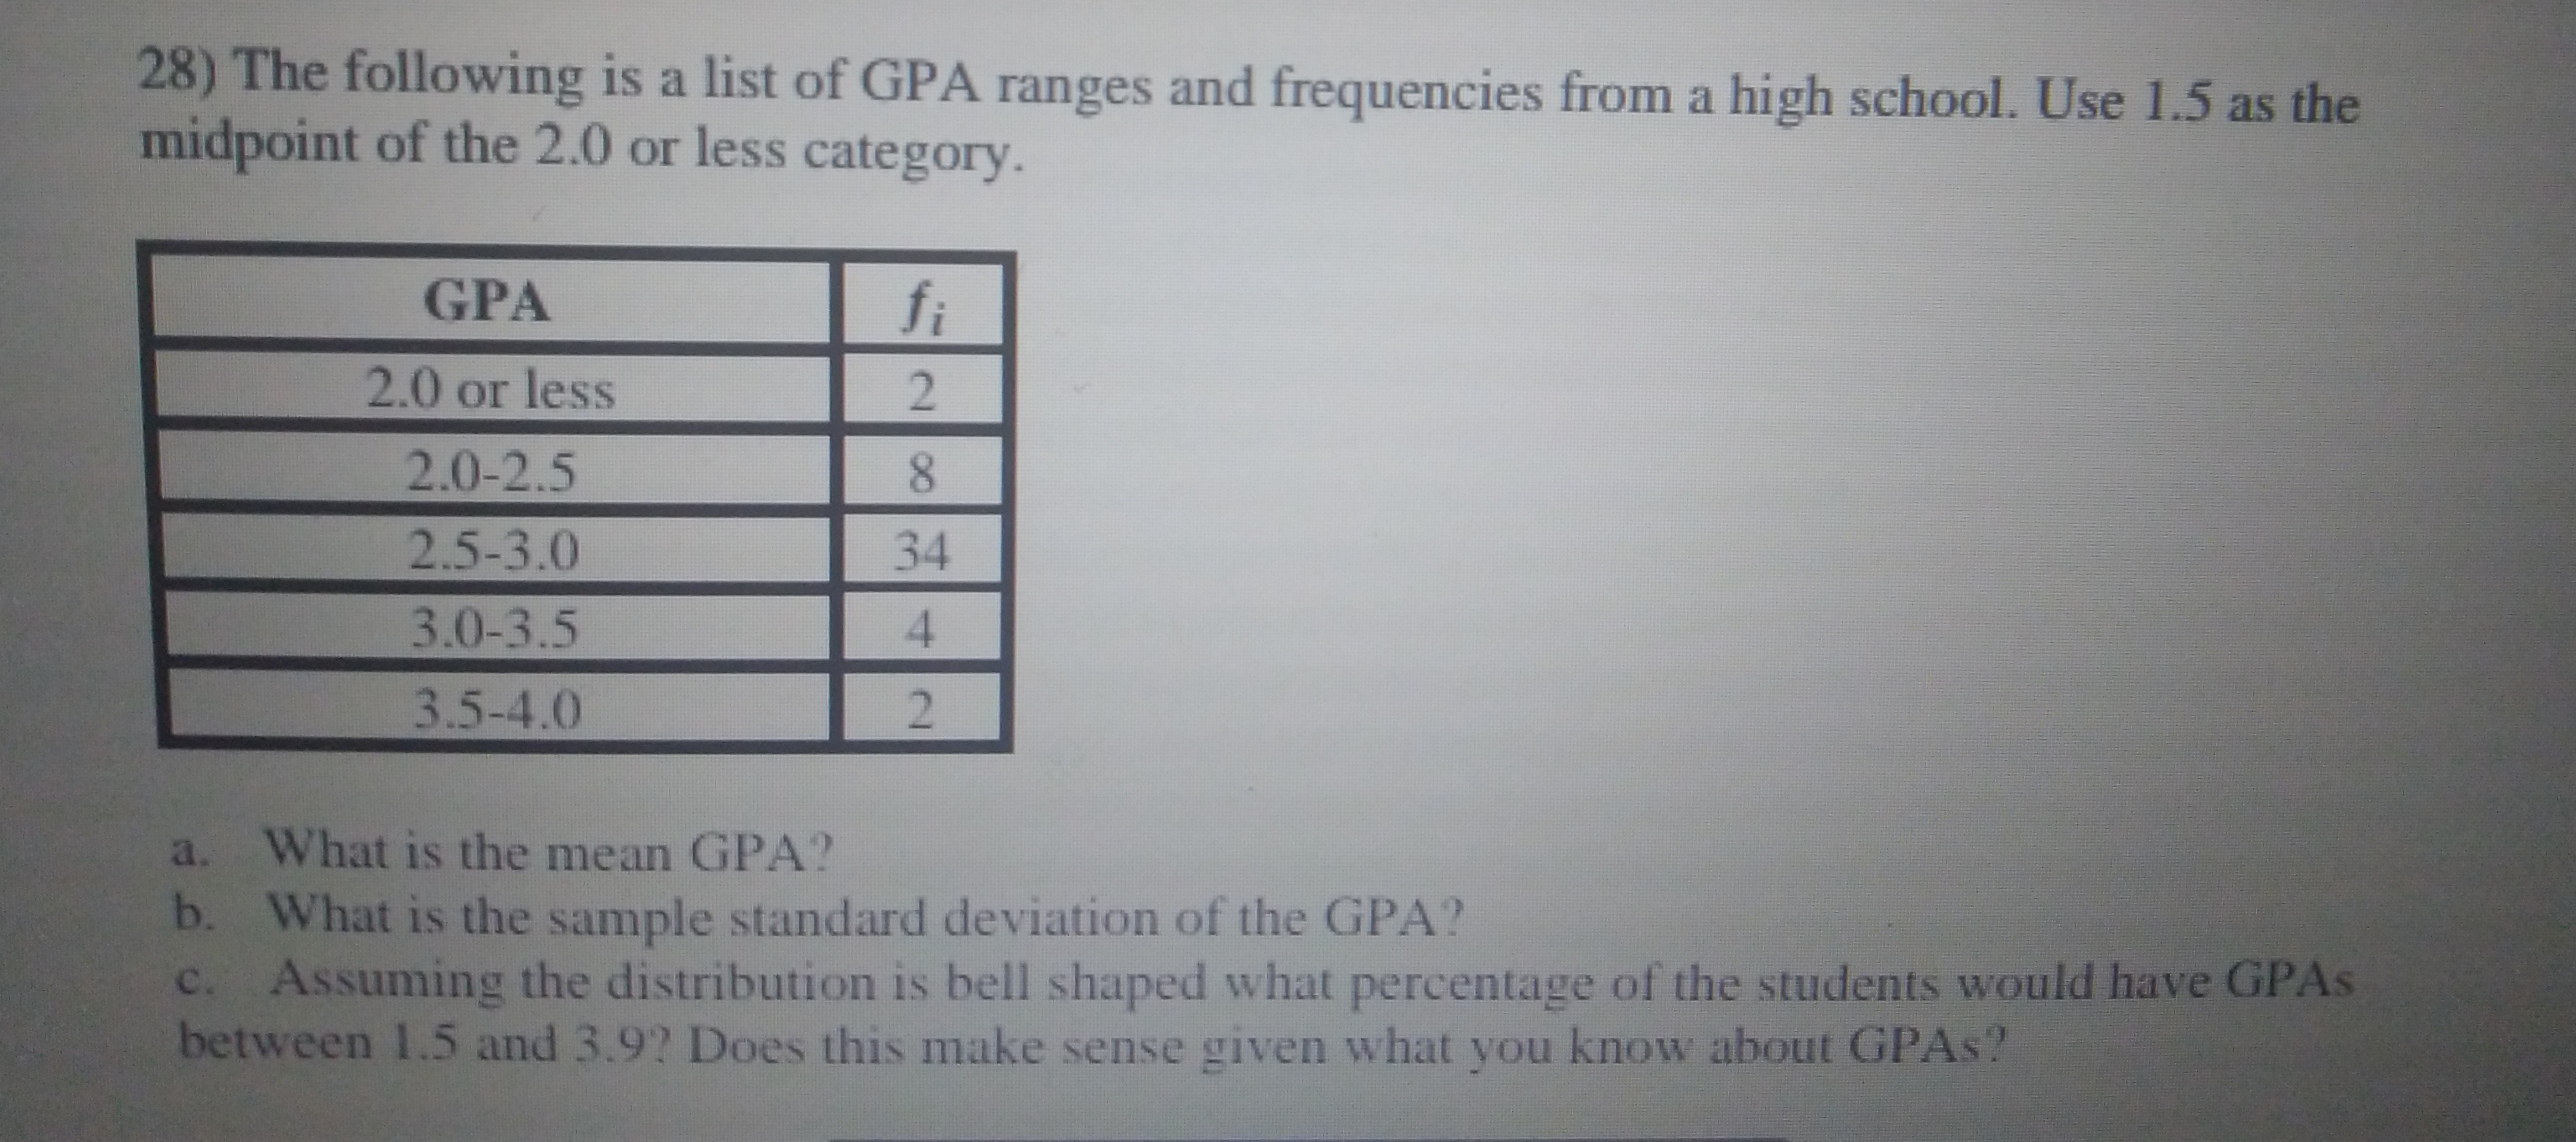
28) The following is a list of GPA ranges and frequencies from a high school. Use 1.5 as the midpoint of the 2.0 or less category. GPA fi 2.0 or less 2 2.0-2.5 8 2.5-3.0 34 3.0-3.5 4 3.5-4.0 2 a. What is the mean GPA? b. What is the sample standard deviation of the GPA? c. Assuming the distribution is bell shaped what percentage of the students would have GPAs between 1.5 and 3.9? Does this make sense given what you know about GPAs
Step by Step Solution
There are 3 Steps involved in it
1 Expert Approved Answer
Step: 1 Unlock

Question Has Been Solved by an Expert!
Get step-by-step solutions from verified subject matter experts
Step: 2 Unlock
Step: 3 Unlock