

Answered step by step
Verified Expert Solution
Question
1 Approved Answer
Explain the chart (MA cross and Fibonacci retracement of PLDT identified) . Include trading position (when to buy/sell) Thank you in advance! Bachar21219 published on
Explain the chart (MA cross and Fibonacci retracement of PLDT identified) . Include trading position (when to buy/sell) 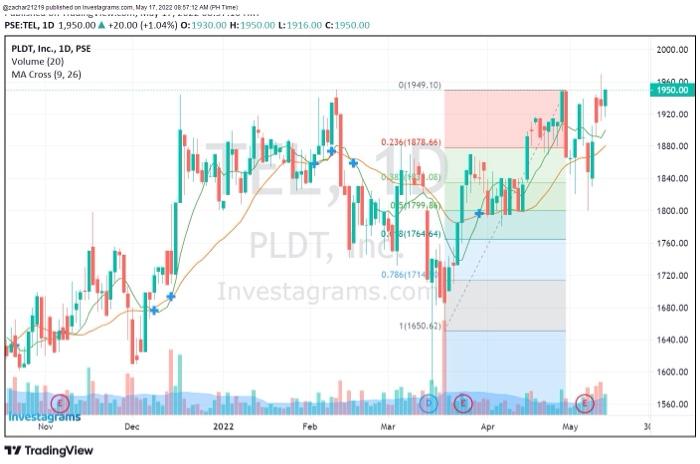
Bachar21219 published on stagram.com May 17, 2122 08:57:12 AM (PHL Time) WE PSE:TEL, 1D 1,950.00 A +20.00 (+1.04%) 0:1930.00 H:195000 L:1916.00 C: 1950.00 PLDT, Inc., 1D, PSE Volume (20) MA Cross (9.26) 2000.00 0/1949.101 196000 1950.00 1920.00 0.2361875.66 1880.00 cole Sers) 1840.00 in fin 054799,6 1800.00 0841764641 1760.00 0.786714 1720.00 , All PLDT, Investagrams.coril (1650.67) 1680.00 1640.00 1600.00 huhe Lindsaluku 1560.00 Investagrams Nov Dec 2022 Feb Mar Apr May 34 17 TradingView Thank you in advance!
Step by Step Solution
There are 3 Steps involved in it
Step: 1

Get Instant Access to Expert-Tailored Solutions
See step-by-step solutions with expert insights and AI powered tools for academic success
Step: 2

Step: 3
Ace Your Homework with AI
Get the answers you need in no time with our AI-driven, step-by-step assistance
Get Started
Principles Of Financial Management
Authors: Haim Levy, Marshall Sarnat
1st Edition
0137097751, 978-0137097753