Answered step by step
Verified Expert Solution
Question
1 Approved Answer
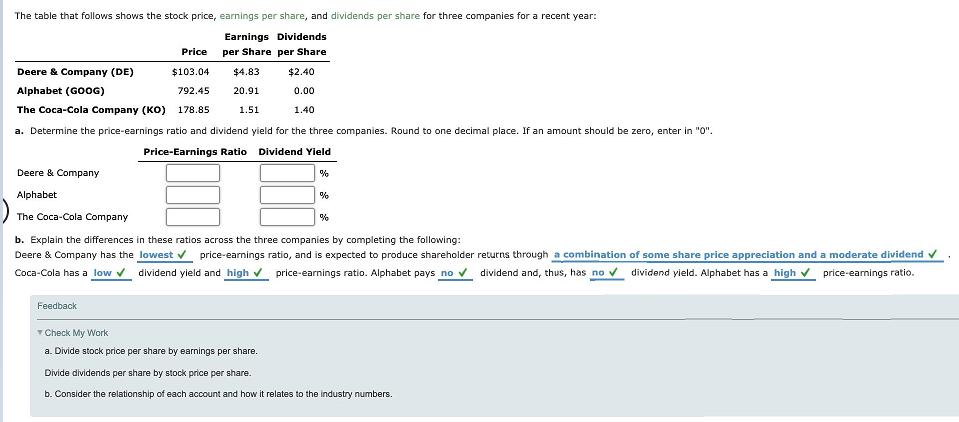
The table that follows shows the stock price, earnings per share, and dividends per share for three companies for a recent year: Earnings Dividends

The table that follows shows the stock price, earnings per share, and dividends per share for three companies for a recent year: Earnings Dividends Price per Share per Share Deere & Company (DE) $103.04 $4.83 $2.40 Alphabet (GOOG) 792.45 20.91 0.00 The Coca-Cola Company (KO) 178.85 1.51 1.40 a. Determine the price-earnings ratio and dividend yield for the three companies. Round to one decimal place. If an amount should be zero, enter in "0". Price-Earnings Ratio Dividend Yield Deere & Company Alphabet The Coca-Cola Company % b. Explain the differences in these ratios across the three companies by completing the following: Deere & Company has the lowest v price-earnings ratio, and is expected to produce shareholder returns through a combination of some share price appreciation and a moderate dividend v Coca-Cola has a low v dividend yield and high v price-earnings ratio. Alphabet pays no v dividend and, thus, has no v dividend yield. Alphabet has a high v price-eamings ratio. Feedback T Check My Work a. Divide stock price per share by earnings per share. Divide dividends per share by stock price per share. b. Consider the relationship of each account and how it relates to the industry numbers.
Step by Step Solution
★★★★★
3.46 Rating (153 Votes )
There are 3 Steps involved in it
Step: 1
Price Earnings ratio Deere Alphabet Coca cola Price per share 10304 79245 17...
Get Instant Access to Expert-Tailored Solutions
See step-by-step solutions with expert insights and AI powered tools for academic success
Step: 2

Step: 3

Ace Your Homework with AI
Get the answers you need in no time with our AI-driven, step-by-step assistance
Get Started


