Question
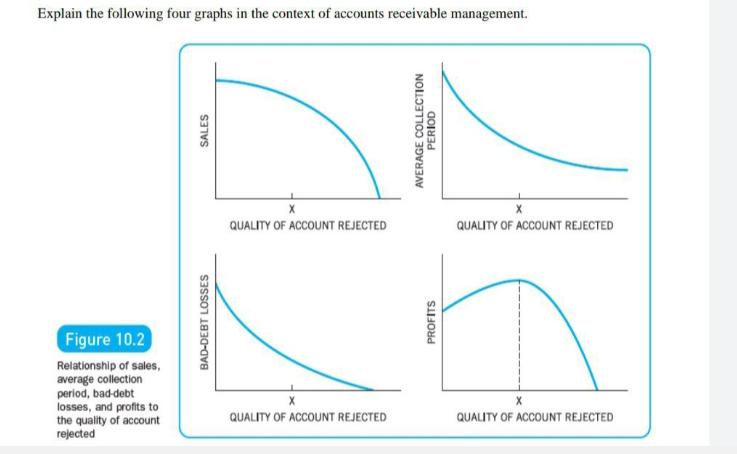
Figure 10.2 Relationship of sales, average collection period, bad debt losses, and profits to the quality of account rejected BAD-DEBT LOSSES Explain the following

Figure 10.2 Relationship of sales, average collection period, bad debt losses, and profits to the quality of account rejected BAD-DEBT LOSSES Explain the following four graphs in the context of accounts receivable management. SALES AVERAGE COLLECTION PERIOD QUALITY OF ACCOUNT REJECTED QUALITY OF ACCOUNT REJECTED PROFITS QUALITY OF ACCOUNT REJECTED QUALITY OF ACCOUNT REJECTED
Step by Step Solution
There are 3 Steps involved in it
Step: 1
The four graphs in the context of accounts receivable management represent the relationship between sales average collection period baddebt losses pro...
Get Instant Access to Expert-Tailored Solutions
See step-by-step solutions with expert insights and AI powered tools for academic success
Step: 2

Step: 3

Ace Your Homework with AI
Get the answers you need in no time with our AI-driven, step-by-step assistance
Get StartedRecommended Textbook for
Financial Accounting
Authors: Libby, Short
6th Edition
978-0071284714, 9780077300333, 71284710, 77300335, 978-0073526881
Students also viewed these Finance questions
Question
Answered: 1 week ago
Question
Answered: 1 week ago
Question
Answered: 1 week ago
Question
Answered: 1 week ago
Question
Answered: 1 week ago
Question
Answered: 1 week ago
Question
Answered: 1 week ago
Question
Answered: 1 week ago
Question
Answered: 1 week ago
Question
Answered: 1 week ago
Question
Answered: 1 week ago
Question
Answered: 1 week ago
Question
Answered: 1 week ago
Question
Answered: 1 week ago
Question
Answered: 1 week ago
Question
Answered: 1 week ago
Question
Answered: 1 week ago
Question
Answered: 1 week ago
Question
Answered: 1 week ago
Question
Answered: 1 week ago
Question
Answered: 1 week ago
View Answer in SolutionInn App


