

Answered step by step
Verified Expert Solution
Question
1 Approved Answer
explain the table Exhibits Condidated Financial Statements in US miliom Jan 1-Dec 31, 2013 Jan 1-Dec 31, 2012 Consolidated statement of income Sales Operating income
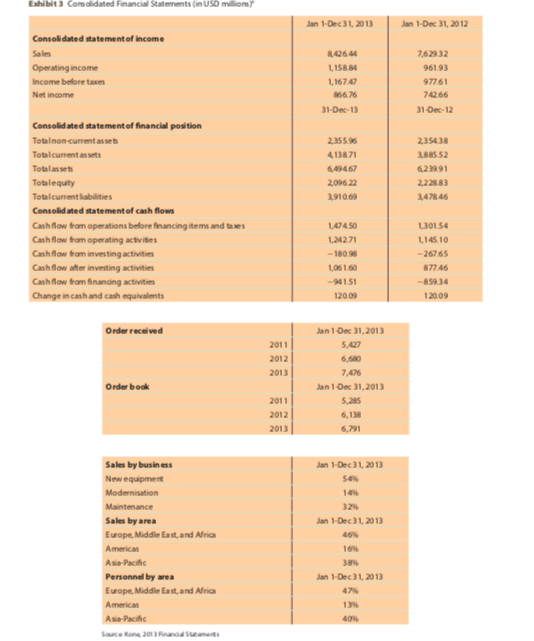
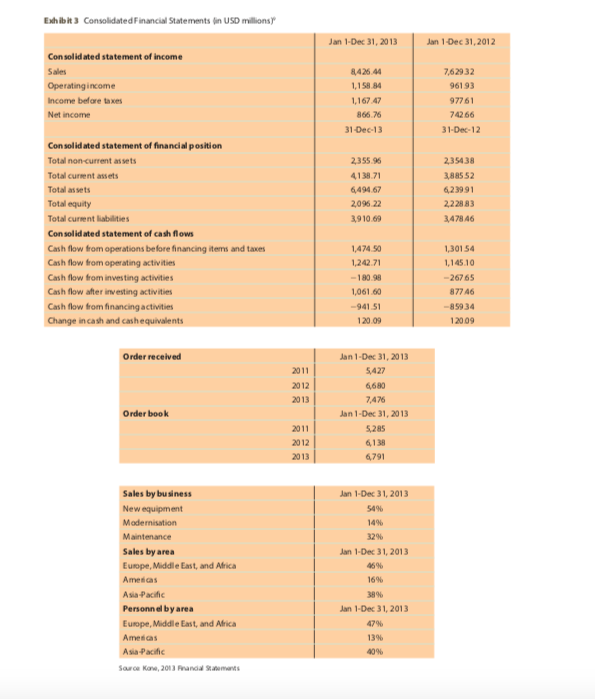
explain the table
Exhibits Condidated Financial Statements in US miliom Jan 1-Dec 31, 2013 Jan 1-Dec 31, 2012 Consolidated statement of income Sales Operating income Income before taxes Net income 8.426 40 1,158.84 1,167.47 866.76 31-Dec-13 7,629.32 961.93 97761 74266 31-Dec-12 2,355.96 4138.71 6,49467 2,096 22 3,910.69 2.35438 388552 6.239.91 222883 3,47846 Consolidated statement of financial position Totalnon-current assets Totalcurrent assets Totalasses Totalequity Totalcurrent liabilities Consolidated statement of cash flows Cash flow from operations before financing items and taxes Cash flow from operating activities Cash flow from investing activities Cash flow after investing activities Cash flow from financing activities Change in cash and cash equivalents 1,474.50 1,24271 - 180.98 1,051 60 -90151 12000 1,301.54 1,145.10 -26765 877.46 -85934 12009 Order received Jan 1 Dec 31, 2013 5.427 2011 2012 2013 6,630 Order bock 2011 2012 2013 7.476 Jan 1-Dec 31, 2013 5,285 6,138 6,791 Sales by business New equipment Modernisation Maintenance Sales by area Europe, Middle East, and Mrican Americas Asia Pacific Personnel by wea Europe, Middle East, and Africa Americas Asia Pacific Sauce Kone 2013 and Scaneres Jan 1-Dec 31, 2013 Sex 10 325 Jan 1-Dec 31, 2013 46 16 30 Jan 1-Dec 31, 2013 47 13 408 Exhibit 3 Consolidated Financial Statements in USD millions) Jan 1-Dec 31, 2013 Jan 1-Dec 31, 2012 Consolidated statement of income Sales Operating income Income before taxes Net income 8,426.44 1,158.84 1,167.47 866.76 31-Dec-13 7,62932 96193 97761 74266 31-Dec-12 2,35596 413871 6,494 67 2,09622 3,910.69 2,35438 388552 6.23991 222883 3,478 46 Con solidated statement of financial position Total non-current assets Total current assets Total assets Total equity Total current liabilities Consolidated statement of cash flows Cash flow from operations before financing terms and taxes Cash flow from operating activities Cash flow from investing activities Cash flow after investing activities Cash flow from financing activities Change in cash and cash equivalents 1,474.50 1,242.71 - 180.98 1,061.60 -941.51 120.09 1,30154 1,145.10 -26765 877 46 -85934 1 2009 Order received 2011 2012 2013 Jan 1-Dec 31, 2013 5,427 6,680 7,476 Jan 1-Dec 31, 2013 5,285 6138 Order book 2011 2012 2013 6.791 Jan 1-Dec 31, 2013 54% 14% 12 Sales by business New equipment Modernisation Maintenance Sales by area Europe, Middle East, and Africa Americas Asia Pacific Personnel by area Europe, Middle East, and Africa Americas Asia Pacific Source Kone, 2013 Randal Statements Jan 1-Dec 31, 2013 45% 16% 38% Jan 1-Dec 31, 2013 1396 40%Step by Step Solution
There are 3 Steps involved in it
Step: 1

Get Instant Access to Expert-Tailored Solutions
See step-by-step solutions with expert insights and AI powered tools for academic success
Step: 2

Step: 3
Ace Your Homework with AI
Get the answers you need in no time with our AI-driven, step-by-step assistance
Get Started
Financial Times Guide To Finance For Non Financial Managers
Authors: Jo Haigh
1st Edition
0273756206, 978-0273756200