

Question
Explain what does the plot shows? X attach(X) m m m newdata predict (m, newdata) # visualize: plot(X, col = 1:1000 %in% m$index + 1,
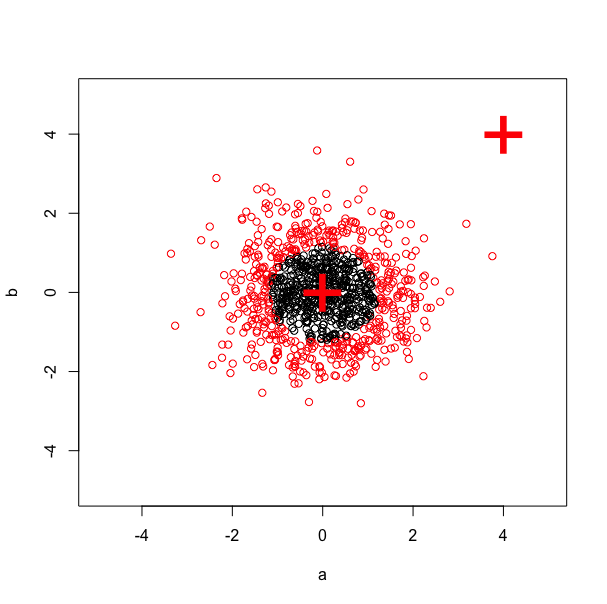
Explain what does the plot shows?
X
attach(X)
m
m
m
newdata
predict (m, newdata)
# visualize:
plot(X, col = 1:1000 %in% m$index + 1, xlim = c(-5,5), ylim=c(-5,5))
points(newdata, pch = "+", col = 2, cex = 5)
Step by Step Solution
There are 3 Steps involved in it
Step: 1

Get Instant Access to Expert-Tailored Solutions
See step-by-step solutions with expert insights and AI powered tools for academic success
Step: 2

Step: 3
Ace Your Homework with AI
Get the answers you need in no time with our AI-driven, step-by-step assistance
Get Started
Auditing and Assurance Services A Systematic Approach
Authors: William Messier, Steven Glover, Douglas Prawitt
9th edition
1308361491, 77862333, 978-1259248290, 9780077862336, 1259162346, 978-1259162343