Answered step by step
Verified Expert Solution
Question
1 Approved Answer
Explain what we learn from this Table. TABLE 7.4 Regression statistics for alternative specifications: 1. A Single index with S&P 500 as market proxy 1.
Explain what we learn from this Table.
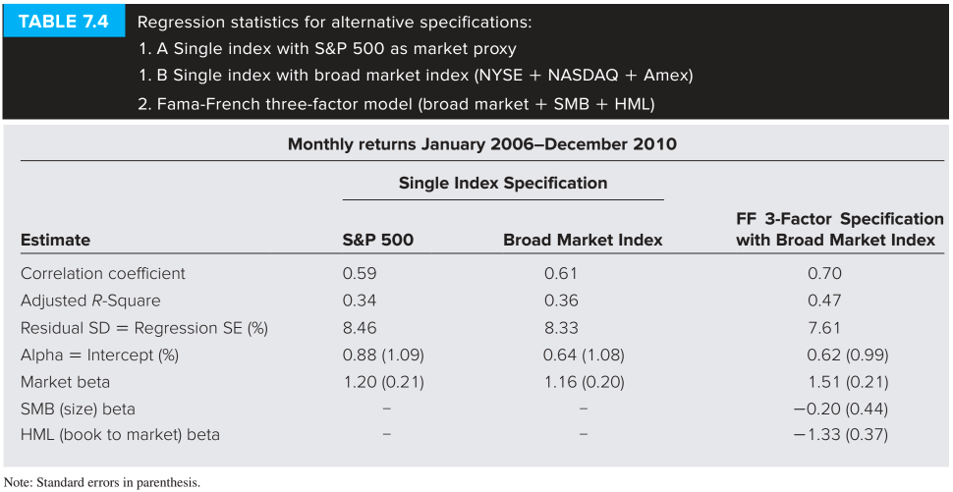
TABLE 7.4 Regression statistics for alternative specifications: 1. A Single index with S&P 500 as market proxy 1. B Single index with broad market index (NYSE + NASDAQ + Amex) 2. Fama-French three-factor model (broad market + SMB + HML) Monthly returns January 2006 December 2010 Single Index Specification FF 3-Factor Specification with Broad Market Index S&P 500 Broad Market Index 0.59 0.34 0.61 0.36 0.70 0.47 Estimate Correlation coefficient Adjusted R-Square Residual SD = Regression SE (%) Alpha = Intercept (%) Market beta SMB (size) beta HML (book to market) beta 8.46 0.88 (1.09) 1.20 (0.21) 8.33 0.64 (1.08) 1.16 (0.20) 7.61 0.62 (0.99) 1.51 (0.21) -0.20 (0.44) -1.33 (0.37) Note: Standard errors in parenthesis. TABLE 7.4 Regression statistics for alternative specifications: 1. A Single index with S&P 500 as market proxy 1. B Single index with broad market index (NYSE + NASDAQ + Amex) 2. Fama-French three-factor model (broad market + SMB + HML) Monthly returns January 2006 December 2010 Single Index Specification FF 3-Factor Specification with Broad Market Index S&P 500 Broad Market Index 0.59 0.34 0.61 0.36 0.70 0.47 Estimate Correlation coefficient Adjusted R-Square Residual SD = Regression SE (%) Alpha = Intercept (%) Market beta SMB (size) beta HML (book to market) beta 8.46 0.88 (1.09) 1.20 (0.21) 8.33 0.64 (1.08) 1.16 (0.20) 7.61 0.62 (0.99) 1.51 (0.21) -0.20 (0.44) -1.33 (0.37) Note: Standard errors in parenthesisStep by Step Solution
There are 3 Steps involved in it
Step: 1
Get Instant Access to Expert-Tailored Solutions
See step-by-step solutions with expert insights and AI powered tools for academic success
Step: 2
Step: 3
Ace Your Homework with AI
Get the answers you need in no time with our AI-driven, step-by-step assistance
Get Started