-
Explain why depreciation and amortization appear as an addition when net income is converted to cash flow from operations.
-
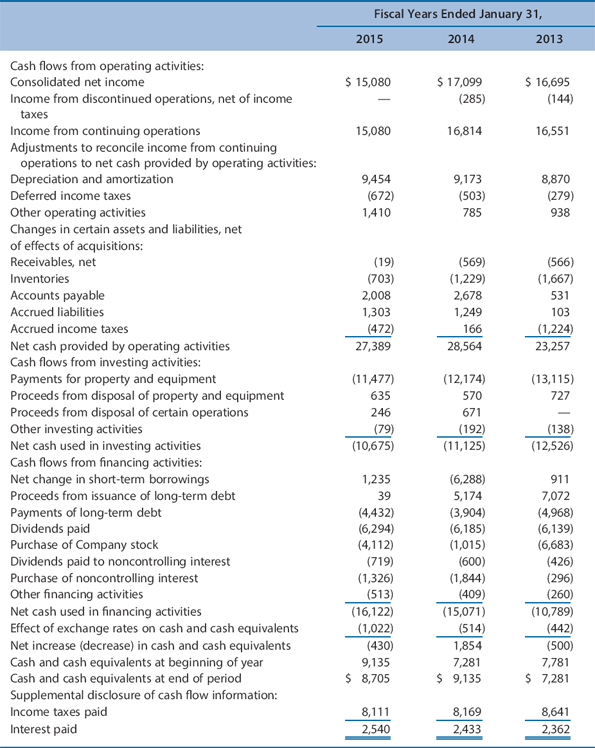
For 2016, Walmart shows an adjustment for inventories of negative $703 million. However, on the balance sheet, inventories declined from $45,141 million to $44,469 million, a difference of $672 million. Explain the $703 million adjustment and offer examples of why the adjustment differs from the change in the inventory balance.
-
Estimate the amount of cash received from customers during 2016.
-
Discuss the relation between net income and cash flow from operations for each of the three years.
-
Discuss the relations among cash flows from operating, investing, and financing activities for each of the three years.
Fiscal Years Ended January 31 2015 2013 Cash flows from operating activities: Consolidated net income Income from discontinued operations, net of income 15,080 17,099 16,695 Income from continuing operations Adjustments to reconcile income from continuing 16,551 operations to net cash provided by operating activities: Depreciation and amortization Deferred income taxes Other operating activities Changes in certain assets and liabilities, net of effects of acquisitions: Receivables, net Inventories Accounts payable Accrued liabilities Accrued income taxes Net cash provided by operating activities Cash flows from investing activities: Payments for property and equipment Proceeds from disposal of property and equipment Proceeds from disposal of certain operations Other investing activities Net cash used in investing activities Cash flows from financing activities: Net change in short-term borrowings Proceeds from issuance of long-term debt Payments of long-term debt Dividends paid Purchase of Company stock Dividends paid to noncontrolling interest Purchase of noncontrolling interest Other financing activities Net cash used in financing activities Effect of exchange rates on cash and cash equivalents Net increase (decrease) in cash and cash equivalents Cash and cash equivalents at beginning of year Cash and cash equivalents at end of period Supplemental disclosure of cash flow information: Income taxes paid Interest paid 8,870 785 938 (566) (1,667) (569) (1,229) 2,678 1,249 2,008 1,303 (1,224) 23,257 27,389 28,564 (12,174) 570 (13,115) 727 635 (138) (12,526) (10,675) 1,235 39 (4,432) (6,294) (4,112) (6,288) 7,072 (4,968) (6,139) (6,683) (3,904) (6,185) 1,015) (600) (1,844) (409) (15,071) (1,326) (513) (16,122) (1,022) (430) (296) (260) (10,789) 1,854 7,281 $9,135 (500) 8,705 $ 7,281 8,641 2,362 2,540 Fiscal Years Ended January 31 2015 2013 Cash flows from operating activities: Consolidated net income Income from discontinued operations, net of income 15,080 17,099 16,695 Income from continuing operations Adjustments to reconcile income from continuing 16,551 operations to net cash provided by operating activities: Depreciation and amortization Deferred income taxes Other operating activities Changes in certain assets and liabilities, net of effects of acquisitions: Receivables, net Inventories Accounts payable Accrued liabilities Accrued income taxes Net cash provided by operating activities Cash flows from investing activities: Payments for property and equipment Proceeds from disposal of property and equipment Proceeds from disposal of certain operations Other investing activities Net cash used in investing activities Cash flows from financing activities: Net change in short-term borrowings Proceeds from issuance of long-term debt Payments of long-term debt Dividends paid Purchase of Company stock Dividends paid to noncontrolling interest Purchase of noncontrolling interest Other financing activities Net cash used in financing activities Effect of exchange rates on cash and cash equivalents Net increase (decrease) in cash and cash equivalents Cash and cash equivalents at beginning of year Cash and cash equivalents at end of period Supplemental disclosure of cash flow information: Income taxes paid Interest paid 8,870 785 938 (566) (1,667) (569) (1,229) 2,678 1,249 2,008 1,303 (1,224) 23,257 27,389 28,564 (12,174) 570 (13,115) 727 635 (138) (12,526) (10,675) 1,235 39 (4,432) (6,294) (4,112) (6,288) 7,072 (4,968) (6,139) (6,683) (3,904) (6,185) 1,015) (600) (1,844) (409) (15,071) (1,326) (513) (16,122) (1,022) (430) (296) (260) (10,789) 1,854 7,281 $9,135 (500) 8,705 $ 7,281 8,641 2,362 2,540