

Answered step by step
Verified Expert Solution
Question
1 Approved Answer
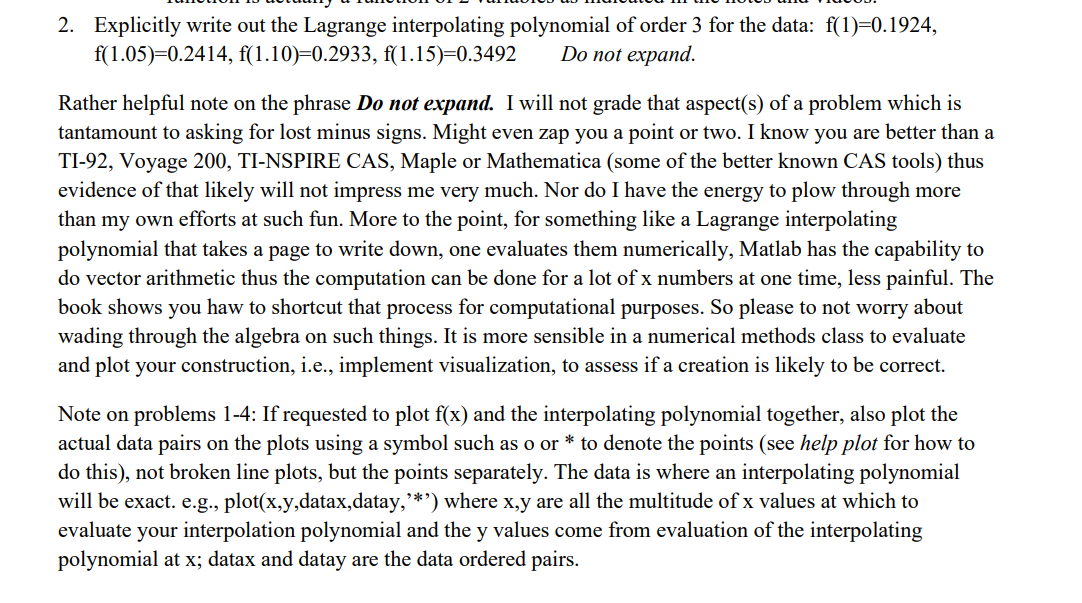
Explicitly write out the Lagrange interpolating polynomial of order 3 for the data: f ( 1 ) = 0 . 1 9 2 4 ,
Explicitly write out the Lagrange interpolating polynomial of order for the data:
Do not expand.
Rather helpful note on the phrase Do not expand. I will not grade that aspects of a problem which is
tantamount to asking for lost minus signs. Might even zap you a point or two. I know you are better than a
TI Voyage TINSPIRE CAS, Maple or Mathematica some of the better known CAS tools thus
evidence of that likely will not impress me very much. Nor do I have the energy to plow through more
than my own efforts at such fun. More to the point, for something like a Lagrange interpolating
polynomial that takes a page to write down, one evaluates them numerically, Matlab has the capability to
do vector arithmetic thus the computation can be done for a lot of numbers at one time, less painful. The
book shows you haw to shortcut that process for computational purposes. So please to not worry about
wading through the algebra on such things. It is more sensible in a numerical methods class to evaluate
and plot your construction, ie implement visualization, to assess if a creation is likely to be correct.
Note on problems : If requested to plot and the interpolating polynomial together, also plot the
actual data pairs on the plots using a symbol such as o or to denote the points see help plot for how to
do this not broken line plots, but the points separately. The data is where an interpolating polynomial
will be exact. eg plotxydatax,datay, where are all the multitude of values at which to
evaluate your interpolation polynomial and the y values come from evaluation of the interpolating
polynomial at ; datax and datay are the data ordered pairs.
Step by Step Solution
There are 3 Steps involved in it
Step: 1

Get Instant Access to Expert-Tailored Solutions
See step-by-step solutions with expert insights and AI powered tools for academic success
Step: 2

Step: 3
Ace Your Homework with AI
Get the answers you need in no time with our AI-driven, step-by-step assistance
Get Started
Database Management With Website Development Applications
Authors: Greg Riccardi
1st Edition
0201743876, 978-0201743876