Answered step by step
Verified Expert Solution
Question
1 Approved Answer
Exponential activity The following data and graph is a limited population history of the city of Toledo Year Population 1860 13768 Toledo Population from 1860-1950
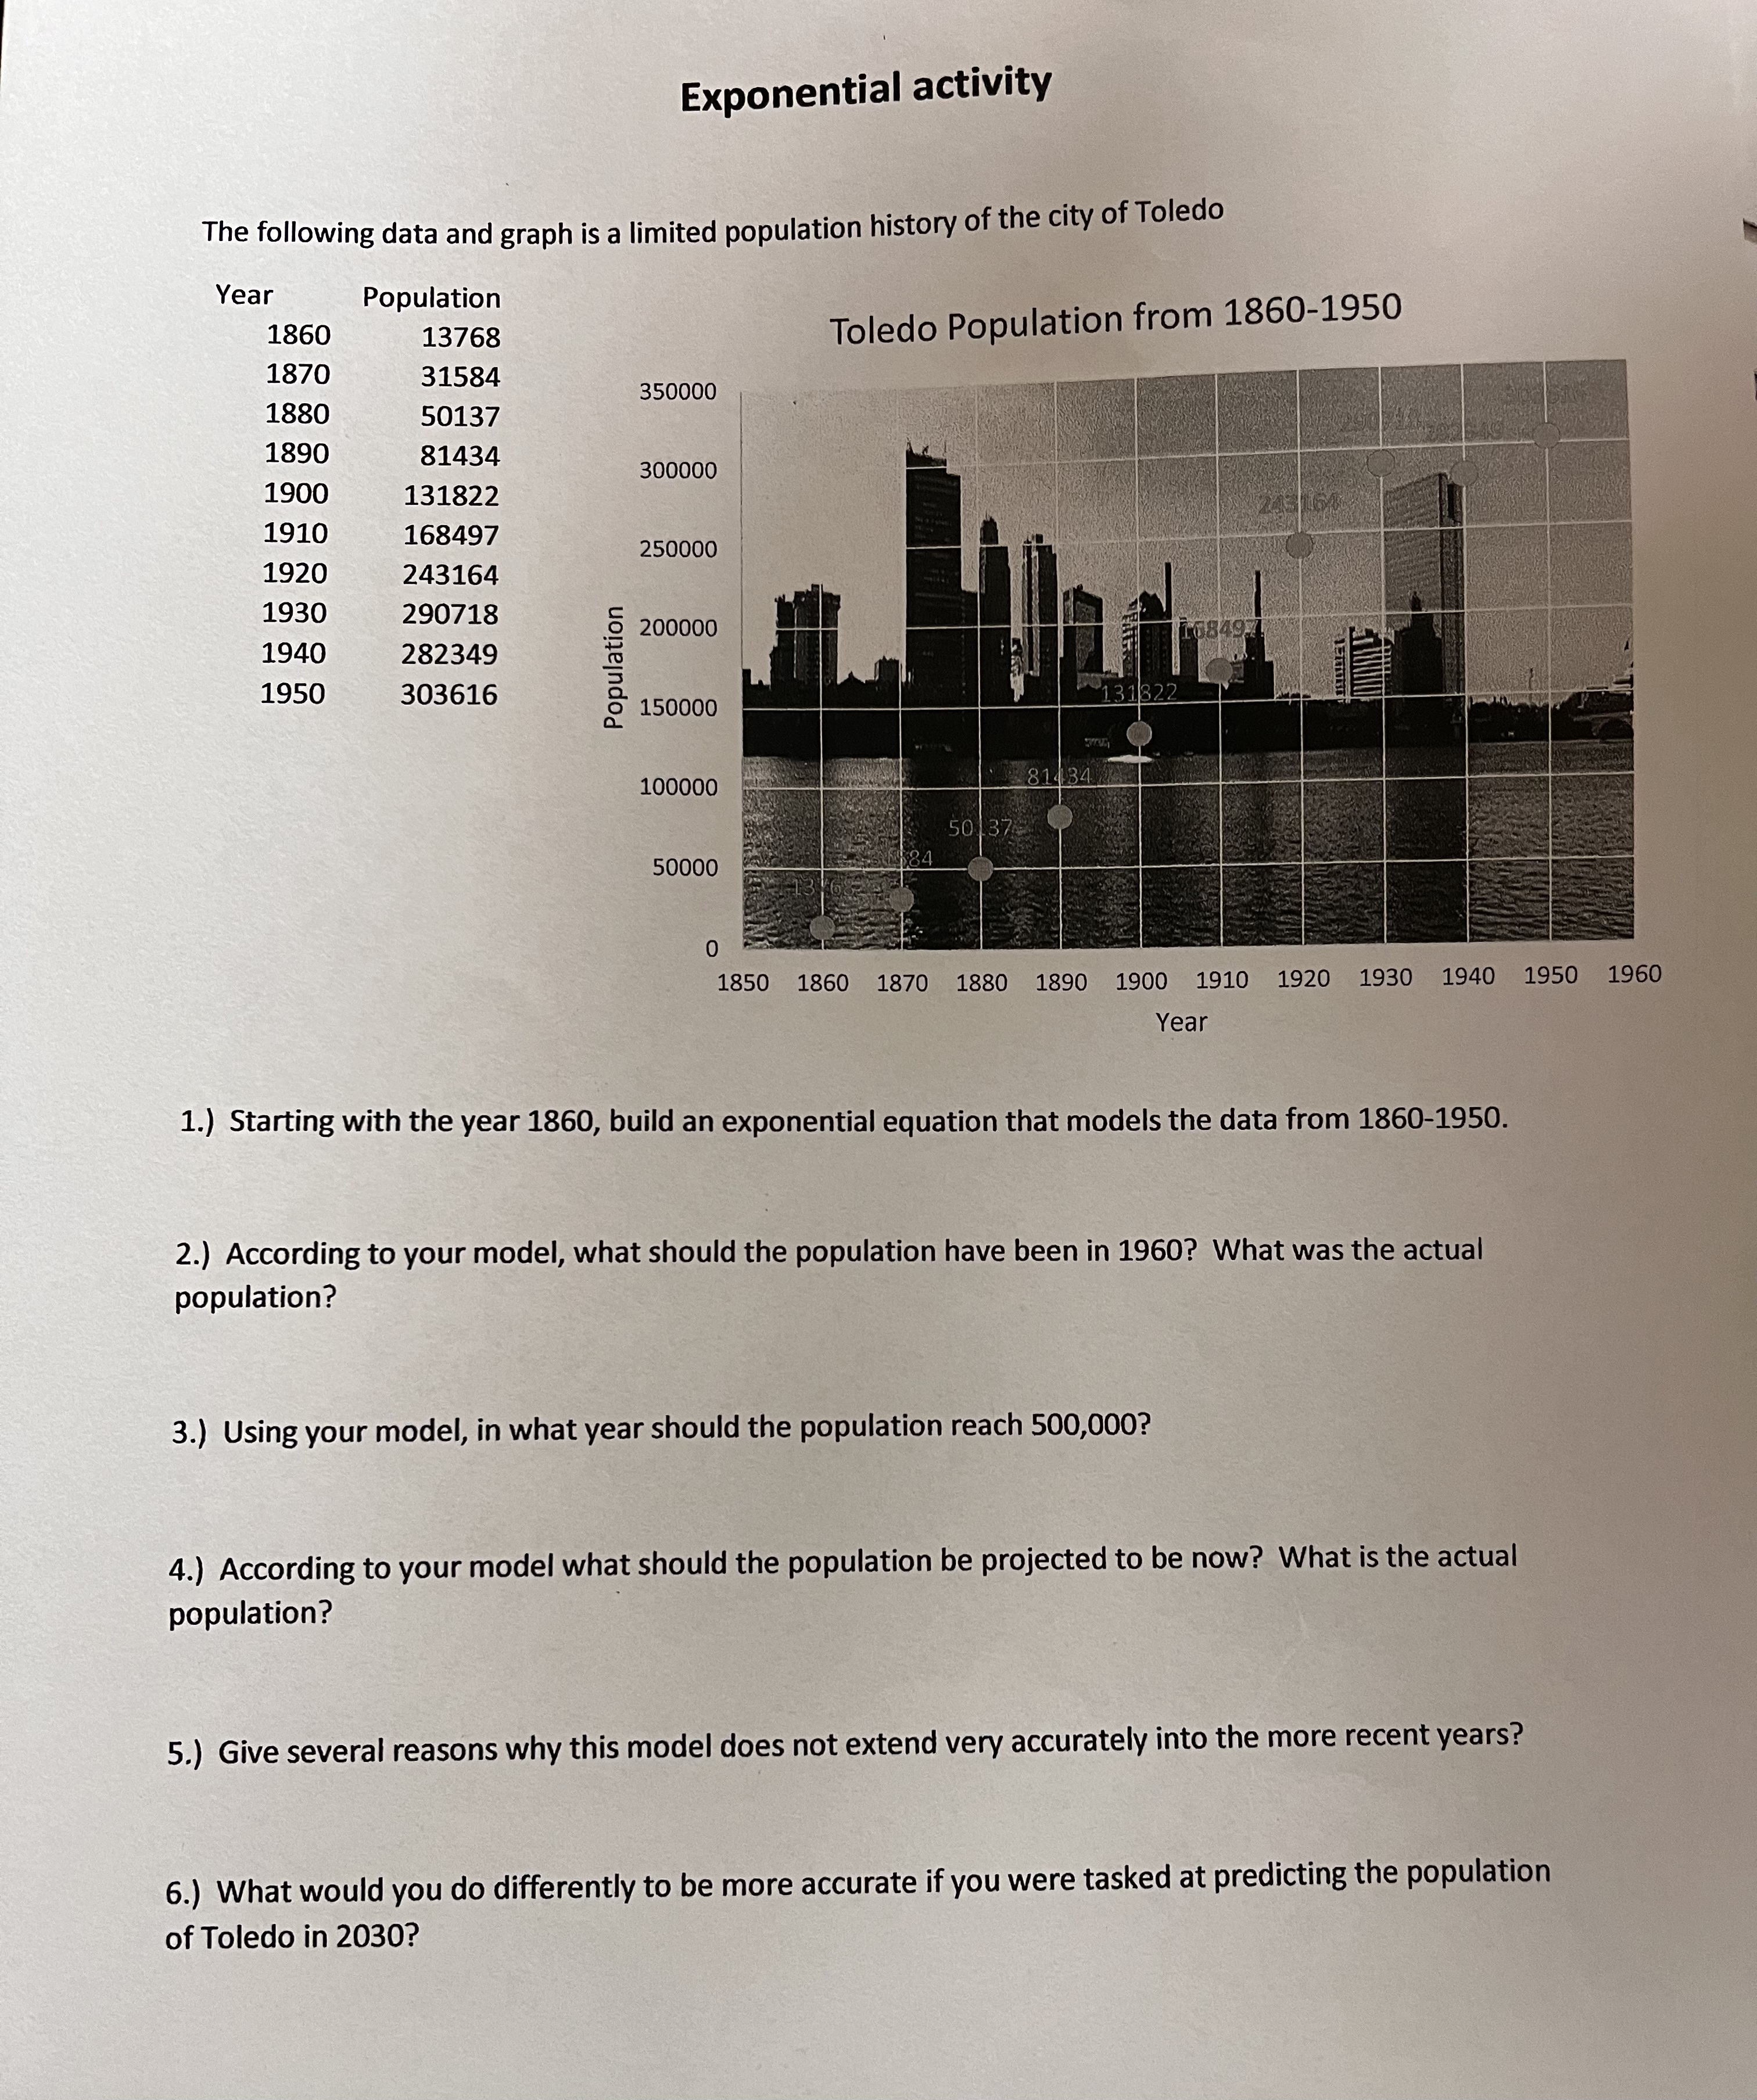
Exponential activity The following data and graph is a limited population history of the city of Toledo Year Population 1860 13768 Toledo Population from 1860-1950 1870 31584 350000 1880 50137 1890 81434 300000 1900 131822 1910 68497 250000 1920 243164 1930 290718 200000 1940 282349 Population 1950 303616 131822 150000 100000 81484 50 37 50000 1850 1860 1870 1880 1890 1900 1910 1920 1930 1940 1950 1960 Year 1.) Starting with the year 1860, build an exponential equation that models the data from 1860-1950. 2.) According to your model, what should the population have been in 1960? What was the actual population? 3.) Using your model, in what year should the population reach 500,000? 4.) According to your model what should the population be projected to be now? What is the actual population? 5.) Give several reasons why this model does not extend very accurately into the more recent years? 6.) What would you do differently to be more accurate if you were tasked at predicting the population of Toledo in 2030
Step by Step Solution
There are 3 Steps involved in it
Step: 1
Get Instant Access to Expert-Tailored Solutions
See step-by-step solutions with expert insights and AI powered tools for academic success
Step: 2
Step: 3
Ace Your Homework with AI
Get the answers you need in no time with our AI-driven, step-by-step assistance
Get Started