Question
Exponential Smoothing. Use Excel Spreadsheet (Copy the table below and Paste it into Excel). The following tabulations are actual sales of units for six

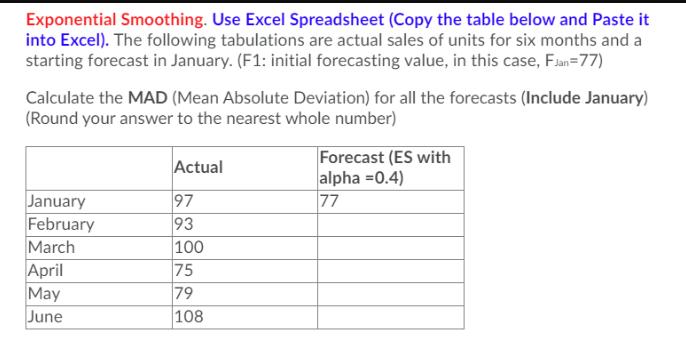
Exponential Smoothing. Use Excel Spreadsheet (Copy the table below and Paste it into Excel). The following tabulations are actual sales of units for six months and a starting forecast in January. (F1: initial forecasting value, in this case, Fan=77) Calculate the MAD (Mean Absolute Deviation) for all the forecasts (Include January) (Round your answer to the nearest whole number) January February March April May June Actual 97 93 100 75 79 108 Forecast (ES with alpha=0.4) 77
Step by Step Solution
There are 3 Steps involved in it
Step: 1

Get Instant Access to Expert-Tailored Solutions
See step-by-step solutions with expert insights and AI powered tools for academic success
Step: 2

Step: 3

Ace Your Homework with AI
Get the answers you need in no time with our AI-driven, step-by-step assistance
Get StartedRecommended Textbook for
Operations And Supply Chain Management
Authors: F. Robert Jacobs, Richard Chase
14th Edition
978-0077824921, 78024021, 9780077823344, 007782492X, 77823346, 978-0078024023
Students also viewed these General Management questions
Question
Answered: 1 week ago
Question
Answered: 1 week ago
Question
Answered: 1 week ago
Question
Answered: 1 week ago
Question
Answered: 1 week ago
Question
Answered: 1 week ago
Question
Answered: 1 week ago
Question
Answered: 1 week ago
Question
Answered: 1 week ago
Question
Answered: 1 week ago
Question
Answered: 1 week ago
Question
Answered: 1 week ago
Question
Answered: 1 week ago
Question
Answered: 1 week ago
Question
Answered: 1 week ago
Question
Answered: 1 week ago
Question
Answered: 1 week ago
Question
Answered: 1 week ago
Question
Answered: 1 week ago
View Answer in SolutionInn App


