

Answered step by step
Verified Expert Solution
Question
1 Approved Answer
Consider the following chart. 130 120 110 100 90 80 I-II 0.8 The (approximate) long run equilibrium is Select one: O A price level
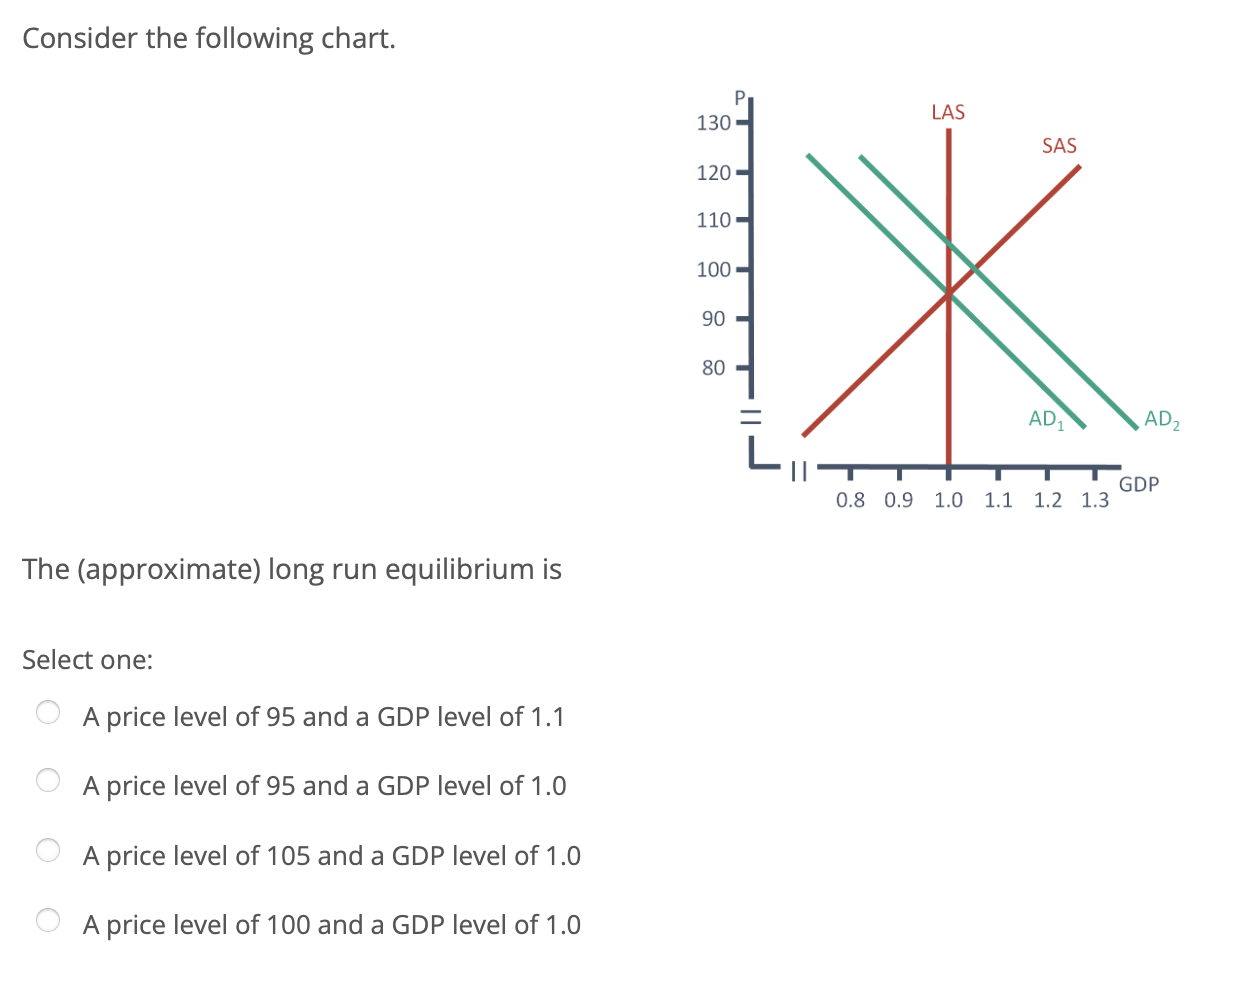

Consider the following chart. 130 120 110 100 90 80 I-II 0.8 The (approximate) long run equilibrium is Select one: O A price level of 95 and a GDP level of 1.1 A price level of 95 and a GDP level of 1.0 o A price level of 105 and a GDP level of 1.0 O A price level of 100 and a GDP level of 1.0 0.9 LAS 1.0 SAS ADI AD2 1.1 GDP 1.2 1.3
Step by Step Solution
There are 3 Steps involved in it
Step: 1

Get Instant Access to Expert-Tailored Solutions
See step-by-step solutions with expert insights and AI powered tools for academic success
Step: 2

Step: 3
Ace Your Homework with AI
Get the answers you need in no time with our AI-driven, step-by-step assistance
Get Started
Intermediate Microeconomics
Authors: Hal R. Varian
8th edition
393934241, 978-0393934243