

Question: 5. The figure shows the density curve that is the probability distribution ofa continuous random variable. Seven values are marked on the density cune.
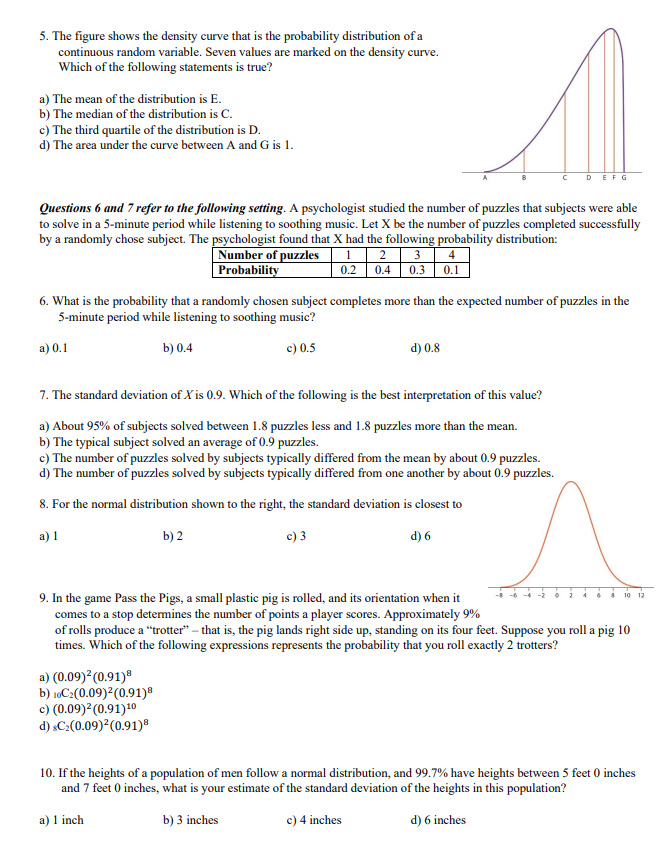
5. The figure shows the density curve that is the probability distribution ofa continuous random variable. Seven values are marked on the density cune. Which of the following statements is true? a) The mean of the distribution is E. b) The median of the distribution is C. c) The third quartile ofthe distribution is D. d) The area under the curve between A and G is I. Questions 6 and 7 refer to the following setting. A psychologist studied the number of puzzles that subjects were able to solve in a 5-minute period while listening to soothing music. Let X be the number of puzzles completed successfully by a randomly chose subject. The psychologist found that X had the following probability distribution: Number of unles I Probabili 02 0.4 0.3 0.1 6. What is the probability that a randomly chosen subject completes more than the expected number of puzzles in the 5-minute period while listening to soothing music? b) 0.4 c) 0.5 d) 0.8 7. The standard deviation ofXis 0.9. Which of the following is the best interpretation of this value? a) About 95% of subjects solved between I .8 punles less and I .8 puzzles more than the mean. b) The typical subject solved an average of 0.9 puzzles. c) The number of puzzles solved by subjects typically differed from the mean by about 0.9 puzzles. d) The number of puzzles solved by subjects typically differed from one another by about 0.9 puzzles. 8. For the normal distribution shown to the right, the standard deviation is closest to 9. In the game Pass the Pigs, a small plastic pig is rolled, and its orientation when it comes to a stop determines the number of a player scores. Approximately 9% of rolls produce a "trotter" that is, the pig lands right side up, standing on its four feet. Suppose you roll a pig 10 times. Which of the following expressions represents the probability that you roll exactly 2 trotters? 10. If the heights of a population ofmen follow a normal distribution, and 99.7% have heights between 5 feet O inches and 7 feet O inches, what is your estimate of the standard deviation of the heights in this population? a) I inch b) 3 inches c) 4 inches d) 6 inches
Step by Step Solution
There are 3 Steps involved in it

Get step-by-step solutions from verified subject matter experts