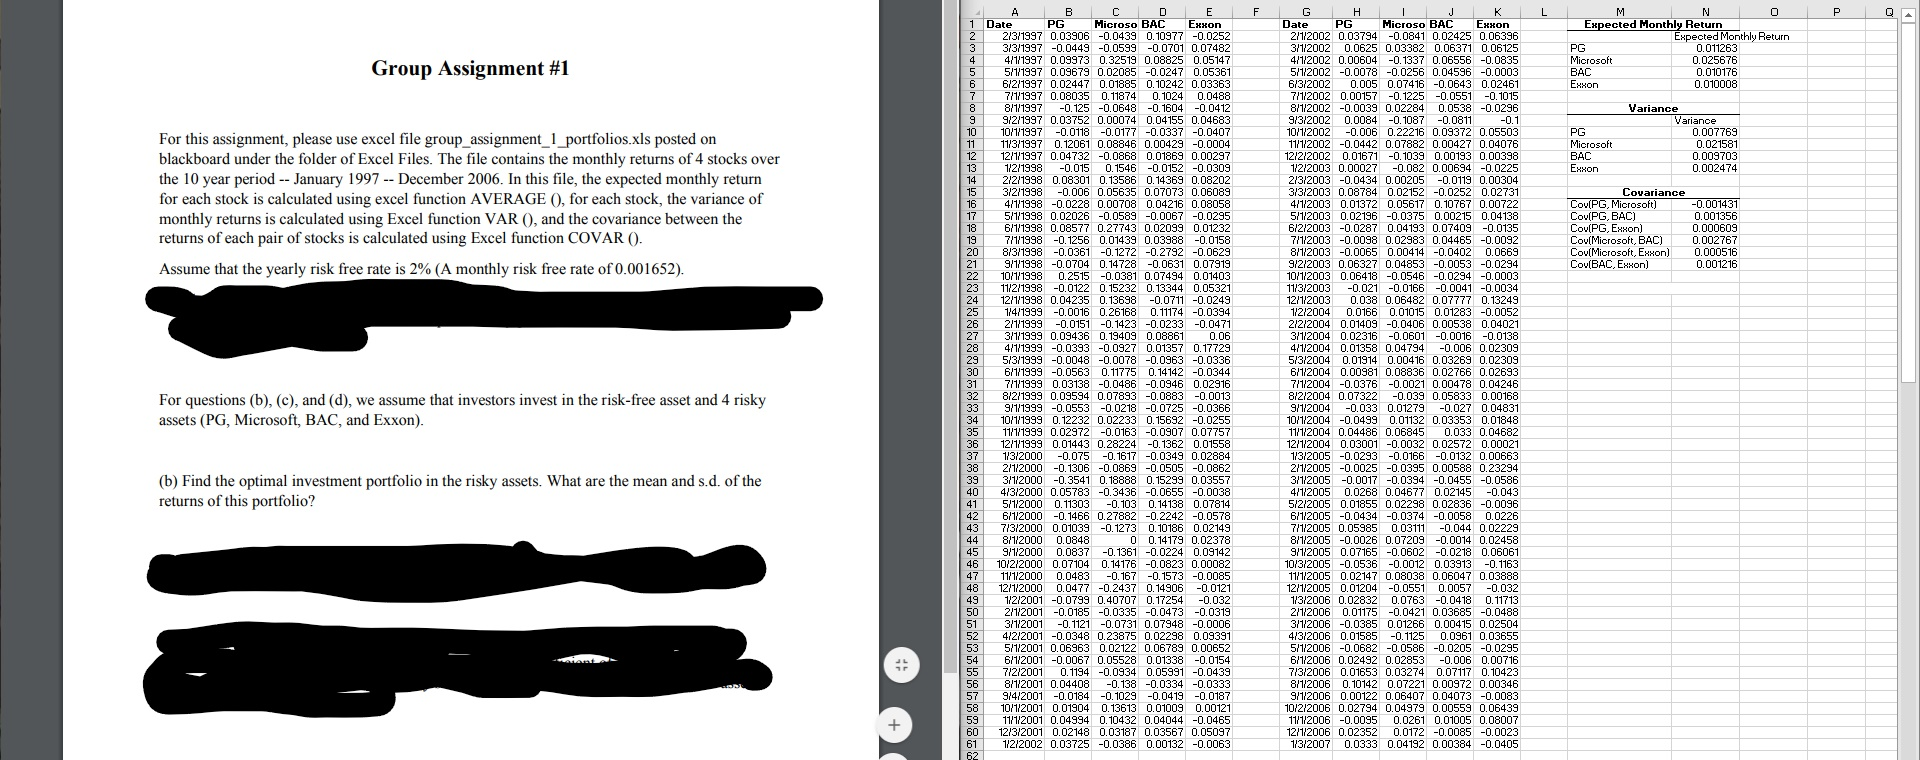
F Expected Monthly Return Expected Monthly Return PG 0.011263 Microsoft 0.025676 BAC 0.010176 Exxon 0.010008 Group Assignment #1 UNEC VOUAWN PG Microsoft BAC Exxon Variance Variance 0.007769 0.021581 0.009703 0.002474 For this assignment, please use excel file group assignment_1_portfolios.xls posted on blackboard under the folder of Excel Files. The file contains the monthly returns of 4 stocks over the 10 year period -- January 1997 -- December 2006. In this file, the expected monthly return for each stock is calculated using excel function AVERAGE (), for each stock, the variance of monthly returns is calculated using Excel function VAR (), and the covariance between the returns of each pair of stocks is calculated using Excel function COVAR 0. Covariance Cov(PG, Microsoft) Cov(PG, BAC) Cov(PG, Exxon) Cov(Microsoft, BAC) Cov(Microsoft, Exxon) Cov(BAC, Exxon) -0.001431 0.001356 0.000609 0.002767 0.000516 0.001216 Assume that the yearly risk free rate is 2% (A monthly risk free rate of 0.001652). 21 A B C D E 1 Date PG Microso BAC Exxon 2/3/1997 0.03906 -0.0439 0.10977 -0.0252 313/1997 -0.0449 -0.0599 -0.0701 0.07482 4/1/1997 0.09973 0.32519 0.08825 0.05147 5/1/1997 0.09679 0.02085 -0.0247 0.05361 6/2/1997 0.02447 0.01885 0.10242 0.03363 7/1/1997 0.08035 0.11874 0.1024 0.0488 8/1/1997 -0.125 -0.0648 -0.1604 -0.0412 9/2/1997 0.03752 0.00074 0.04155 0.04683 10/1/1997 -0.0118 -0.0177 -0.0337 -0.0407 11/3/1997 0.12061 0.08846 0.00429 -0.0004 12/1/1997 0.04732 -0.0868 0.01869 0.00297 1/2/1998 -0.015 0.1546 -0.0152 -0.0309 2/2/1998 0.08301 0.13586 0.14369 0.08202 312/1998 -0.006 0.05635 0.07073 0.06089 4/1/1998 -0.0228 0.00708 0.04216 0.08058 5/1/1998 0.02026 -0.0589 -0.0067 -0.0295 6/1/1998 0.08577 0.27743 0.02099 0.01232 771/1998 -0.1256 0.01439 0.03988 -0.0158 8/3/1998 -0.0361 -0.1272 -0.2792 -0.0629 9/1/1998 -0.0704 0.14728 -0.0631 0.07919 10/1/1998 0.2515 -0.0381 0.07494 0.01403 23 11/2/1998 -0.0122 0.15232 0.13344 0.05321 12/1/1998 0.04235 0.13698 -0.0711 -0.0249 25 1/4/1999 -0.0016 0.26168 0.11174 -0.0394 2/1/1999 -0.0151 -0.1423 -0.0233 -0.0471 3/1/1999 0.09436 0.19409 0.08861 0.06 4/1/1999 -0.0393 -0.0927 0.01357 0.17729 5/3/1999 -0.0048 -0.0078 -0.0963 -0.0336 6/1/1999 -0.0563 0.11775 0.14142 -0.0344 7/1/1999 0.03138 -0.0486 -0.0946 0.02916 8/2/1999 0.09594 0.07893 -0.0883 -0.0013 9/1/1999 -0.0553 -0.0218 -0.0725 -0.0366 10/1/1999 0.12232 0.02233 0.15692 -0.0255 11/1/1999 0.02972 -0.0163 -0.0907 0.07757 12/1/1999 0.01443 0.28224 -0.1362 0.01558 1/3/2000 -0.075 -0.1617 -0.0349 0.02884 38 2/1/2000 -0.1306 -0.0869 -0.0505 -0.0862 3/1/2000 -0.3541 0.18888 0.15299 0.03557 4/3/2000 0.05783 -0.3436 -0.0655 -0.0038 5/1/2000 0.11303 -0.103 0.14138 0.07814 6/1/2000 -0.1466 0.27882 -0.2242 -0.0578 7/3/2000 0.01039 -0.1273 0.10186 0.02149 8/1/2000 0.0848 0 0.14179 0.02378 9/1/2000 0.0837 -0.1361 -0.0224 0.09142 10/2/2000 0.07104 0.14176 -0.0823 0.00082 11/1/2000 0.0483 -0.167 -0.1573 -0.0085 12/1/2000 0.0477 -0.2437 0.14906 -0.0121 1/2/2001 -0.0799 0.40707 0.17254 -0.032 2/1/2001 -0.0185 -0.0335 -0.0473 -0.0319 3/1/2001 -0.1121 -0.0731 0.07948 -0.0006 4/2/2001 -0.0348 0.23875 0.02298 0.09391 5/1/2001 0.06963 0.02122 0.06789 0.00652 6/1/2001 -0.0067 0.05528 0.01338 -0.0154 7/2/2001 0.1194 -0.0934 0.05991 -0.0439 8/1/2001 0.04408 -0.138 -0.0334 -0.0333 9/4/2001 -0.0184 -0.1029 -0.0419 -0.0187 10/1/2001 0.01904 0.13613 0.01009 0.00121 11/1/2001 0.04994 0.10432 0.04044 -0.0465 60 12/3/2001 0.02148 0.03187 0.03567 0.05097 1/2/2002 0.03725 -0.0386 0.00132 -0.0063 G H I J K L Date PG Microso BAC Exxon 2/1/2002 0.03794 -0.0841 0.02425 0.06396 3/1/2002 0.0625 0.03382 0.06371 0.06125 4/1/2002 0.00604 -0.1337 0.06556 -0.0835 5/1/2002 -0.0078 -0.0256 0.04596 -0.0003 6/3/2002 0.005 0.07416 -0.0643 0.02461 7/1/2002 0.00157 -0.1225 -0.0551 -0.1015 8/1/2002 -0.0039 0.02284 0.0538 -0.0296 9/3/2002 0.0084 -0.1087 -0.0811 -0.1 10/1/2002 -0.006 0.22216 0.09372 0.05503 11/1/2002 -0.0442 0.07882 0.00427 0.04076 12/2/2002 0.01671 -0.1039 0.00193 0.00398 1/2/2003 0.00027 -0.082 0.00694 -0.0225 2/3/2003 -0.0434 0.00205 -0.0119 0.00304 3/3/2003 0.08784 0.02152 -0.0252 0.02731 4/1/2003 0.01372 0.05617 0.10767 0.00722 5/1/2003 0.02196 -0.0375 0.00215 0.04138 6/2/2003 -0.0287 0.04193 0.07409 -0.0135 7/1/2003 -0.0098 0.02983 0.04465 -0.0092 8/1/2003 -0.0065 0.00414 -0.0402 0.0669 9/2/2003 0.06327 0.04853 -0.0053 -0.0294 10/1/2003 0.06418 -0.0546 -0.0294 -0.0003 11/3/2003 -0.021 -0.0166 -0.0041 -0.0034 12/1/2003 0.038 0.06482 0.07777 0.13249 1/2/2004 0.0166 0.01015 0.01283 -0.0052 2/2/2004 0.01409 -0.0406 0.00538 0.04021 3/1/2004 0.02316 -0.0601 -0.0016 -0.0138 4/1/2004 0.01358 0.04794 -0.006 0.02309 5/3/2004 0.01914 0.00416 0.03269 0.02309 6/1/2004 0.00981 0.08836 0.02766 0.02693 7/1/2004 -0.0376 -0.0021 0.00478 0.04246 8/2/2004 0.07322 -0.039 0.05833 0.00168 9/1/2004 -0.033 0.01279 -0.027 0.04831 10/1/2004 -0.0499 0.01132 0.03353 0.01848 11/1/2004 0.04486 0.06845 0.033 0.04682 12/1/2004 0.03001 -0.0032 0.02572 0.00021 1/3/2005 -0.0293 -0.0166 -0.0132 0.00663 2/1/2005 -0.0025 -0.0395 0.00588 0.23294 3/1/2005 -0.0017 -0.0394 -0.0455 -0.0586 4/1/2005 0.0268 0.04677 0.02145 -0.043 5/2/2005 0.01855 0.02298 0.02836 -0.0096 6/1/2005 -0.0434 -0.0374 -0.0058 0.0226 7/1/2005 0.05985 0.03111 -0.044 0.02229 8/1/2005 -0.0026 0.07209 -0.0014 0.02458 9/1/2005 0.07165 -0.0602 -0.0218 0.06061 10/3/2005 -0.0536 -0.0012 0.03913 -0.1163 11/1/2005 0.02147 0.08038 0.06047 0.03888 12/1/2005 0.01204 -0.0551 0.0057 -0.032 1/3/2006 0.02832 0.0763 -0.0418 0.11713 2/1/2006 0.01175 -0.0421 0.03685 -0.0488 3/1/2006 -0.0385 0.01266 0.00415 0.02504 4/3/2006 0.01585 -0.1125 0.0961 0.03655 5/1/2006 -0.0682 -0.0586 -0.0205 -0.0295 6/1/2006 0.02492 0.02853 -0.006 0.00716 7/3/2006 0.01653 0.03274 .07117 0.10423 8/1/2006 0.10142 0.07221 0.00972 0.00346 9/1/2006 0.00122 0.06407 0.04073 -0.0083 10/2/2006 0.02794 0.04979 0.00559 0.06439 11/1/2006 -0.0095 0.0261 0.01005 0.08007 12/1/2006 0.02352 0.0172 -0.0085 -0.0023 1/3/2007 0.0333 0.04192 0.00384 -0.0405 For questions (b), (c), and (d), we assume that investors invest in the risk-free asset and 4 risky assets (PG, Microsoft, BAC, and Exxon). 35 37 (b) Find the optimal investment portfolio in the risky assets. What are the mean and s.d. of the returns of this portfolio? 56 57 59 F Expected Monthly Return Expected Monthly Return PG 0.011263 Microsoft 0.025676 BAC 0.010176 Exxon 0.010008 Group Assignment #1 UNEC VOUAWN PG Microsoft BAC Exxon Variance Variance 0.007769 0.021581 0.009703 0.002474 For this assignment, please use excel file group assignment_1_portfolios.xls posted on blackboard under the folder of Excel Files. The file contains the monthly returns of 4 stocks over the 10 year period -- January 1997 -- December 2006. In this file, the expected monthly return for each stock is calculated using excel function AVERAGE (), for each stock, the variance of monthly returns is calculated using Excel function VAR (), and the covariance between the returns of each pair of stocks is calculated using Excel function COVAR 0. Covariance Cov(PG, Microsoft) Cov(PG, BAC) Cov(PG, Exxon) Cov(Microsoft, BAC) Cov(Microsoft, Exxon) Cov(BAC, Exxon) -0.001431 0.001356 0.000609 0.002767 0.000516 0.001216 Assume that the yearly risk free rate is 2% (A monthly risk free rate of 0.001652). 21 A B C D E 1 Date PG Microso BAC Exxon 2/3/1997 0.03906 -0.0439 0.10977 -0.0252 313/1997 -0.0449 -0.0599 -0.0701 0.07482 4/1/1997 0.09973 0.32519 0.08825 0.05147 5/1/1997 0.09679 0.02085 -0.0247 0.05361 6/2/1997 0.02447 0.01885 0.10242 0.03363 7/1/1997 0.08035 0.11874 0.1024 0.0488 8/1/1997 -0.125 -0.0648 -0.1604 -0.0412 9/2/1997 0.03752 0.00074 0.04155 0.04683 10/1/1997 -0.0118 -0.0177 -0.0337 -0.0407 11/3/1997 0.12061 0.08846 0.00429 -0.0004 12/1/1997 0.04732 -0.0868 0.01869 0.00297 1/2/1998 -0.015 0.1546 -0.0152 -0.0309 2/2/1998 0.08301 0.13586 0.14369 0.08202 312/1998 -0.006 0.05635 0.07073 0.06089 4/1/1998 -0.0228 0.00708 0.04216 0.08058 5/1/1998 0.02026 -0.0589 -0.0067 -0.0295 6/1/1998 0.08577 0.27743 0.02099 0.01232 771/1998 -0.1256 0.01439 0.03988 -0.0158 8/3/1998 -0.0361 -0.1272 -0.2792 -0.0629 9/1/1998 -0.0704 0.14728 -0.0631 0.07919 10/1/1998 0.2515 -0.0381 0.07494 0.01403 23 11/2/1998 -0.0122 0.15232 0.13344 0.05321 12/1/1998 0.04235 0.13698 -0.0711 -0.0249 25 1/4/1999 -0.0016 0.26168 0.11174 -0.0394 2/1/1999 -0.0151 -0.1423 -0.0233 -0.0471 3/1/1999 0.09436 0.19409 0.08861 0.06 4/1/1999 -0.0393 -0.0927 0.01357 0.17729 5/3/1999 -0.0048 -0.0078 -0.0963 -0.0336 6/1/1999 -0.0563 0.11775 0.14142 -0.0344 7/1/1999 0.03138 -0.0486 -0.0946 0.02916 8/2/1999 0.09594 0.07893 -0.0883 -0.0013 9/1/1999 -0.0553 -0.0218 -0.0725 -0.0366 10/1/1999 0.12232 0.02233 0.15692 -0.0255 11/1/1999 0.02972 -0.0163 -0.0907 0.07757 12/1/1999 0.01443 0.28224 -0.1362 0.01558 1/3/2000 -0.075 -0.1617 -0.0349 0.02884 38 2/1/2000 -0.1306 -0.0869 -0.0505 -0.0862 3/1/2000 -0.3541 0.18888 0.15299 0.03557 4/3/2000 0.05783 -0.3436 -0.0655 -0.0038 5/1/2000 0.11303 -0.103 0.14138 0.07814 6/1/2000 -0.1466 0.27882 -0.2242 -0.0578 7/3/2000 0.01039 -0.1273 0.10186 0.02149 8/1/2000 0.0848 0 0.14179 0.02378 9/1/2000 0.0837 -0.1361 -0.0224 0.09142 10/2/2000 0.07104 0.14176 -0.0823 0.00082 11/1/2000 0.0483 -0.167 -0.1573 -0.0085 12/1/2000 0.0477 -0.2437 0.14906 -0.0121 1/2/2001 -0.0799 0.40707 0.17254 -0.032 2/1/2001 -0.0185 -0.0335 -0.0473 -0.0319 3/1/2001 -0.1121 -0.0731 0.07948 -0.0006 4/2/2001 -0.0348 0.23875 0.02298 0.09391 5/1/2001 0.06963 0.02122 0.06789 0.00652 6/1/2001 -0.0067 0.05528 0.01338 -0.0154 7/2/2001 0.1194 -0.0934 0.05991 -0.0439 8/1/2001 0.04408 -0.138 -0.0334 -0.0333 9/4/2001 -0.0184 -0.1029 -0.0419 -0.0187 10/1/2001 0.01904 0.13613 0.01009 0.00121 11/1/2001 0.04994 0.10432 0.04044 -0.0465 60 12/3/2001 0.02148 0.03187 0.03567 0.05097 1/2/2002 0.03725 -0.0386 0.00132 -0.0063 G H I J K L Date PG Microso BAC Exxon 2/1/2002 0.03794 -0.0841 0.02425 0.06396 3/1/2002 0.0625 0.03382 0.06371 0.06125 4/1/2002 0.00604 -0.1337 0.06556 -0.0835 5/1/2002 -0.0078 -0.0256 0.04596 -0.0003 6/3/2002 0.005 0.07416 -0.0643 0.02461 7/1/2002 0.00157 -0.1225 -0.0551 -0.1015 8/1/2002 -0.0039 0.02284 0.0538 -0.0296 9/3/2002 0.0084 -0.1087 -0.0811 -0.1 10/1/2002 -0.006 0.22216 0.09372 0.05503 11/1/2002 -0.0442 0.07882 0.00427 0.04076 12/2/2002 0.01671 -0.1039 0.00193 0.00398 1/2/2003 0.00027 -0.082 0.00694 -0.0225 2/3/2003 -0.0434 0.00205 -0.0119 0.00304 3/3/2003 0.08784 0.02152 -0.0252 0.02731 4/1/2003 0.01372 0.05617 0.10767 0.00722 5/1/2003 0.02196 -0.0375 0.00215 0.04138 6/2/2003 -0.0287 0.04193 0.07409 -0.0135 7/1/2003 -0.0098 0.02983 0.04465 -0.0092 8/1/2003 -0.0065 0.00414 -0.0402 0.0669 9/2/2003 0.06327 0.04853 -0.0053 -0.0294 10/1/2003 0.06418 -0.0546 -0.0294 -0.0003 11/3/2003 -0.021 -0.0166 -0.0041 -0.0034 12/1/2003 0.038 0.06482 0.07777 0.13249 1/2/2004 0.0166 0.01015 0.01283 -0.0052 2/2/2004 0.01409 -0.0406 0.00538 0.04021 3/1/2004 0.02316 -0.0601 -0.0016 -0.0138 4/1/2004 0.01358 0.04794 -0.006 0.02309 5/3/2004 0.01914 0.00416 0.03269 0.02309 6/1/2004 0.00981 0.08836 0.02766 0.02693 7/1/2004 -0.0376 -0.0021 0.00478 0.04246 8/2/2004 0.07322 -0.039 0.05833 0.00168 9/1/2004 -0.033 0.01279 -0.027 0.04831 10/1/2004 -0.0499 0.01132 0.03353 0.01848 11/1/2004 0.04486 0.06845 0.033 0.04682 12/1/2004 0.03001 -0.0032 0.02572 0.00021 1/3/2005 -0.0293 -0.0166 -0.0132 0.00663 2/1/2005 -0.0025 -0.0395 0.00588 0.23294 3/1/2005 -0.0017 -0.0394 -0.0455 -0.0586 4/1/2005 0.0268 0.04677 0.02145 -0.043 5/2/2005 0.01855 0.02298 0.02836 -0.0096 6/1/2005 -0.0434 -0.0374 -0.0058 0.0226 7/1/2005 0.05985 0.03111 -0.044 0.02229 8/1/2005 -0.0026 0.07209 -0.0014 0.02458 9/1/2005 0.07165 -0.0602 -0.0218 0.06061 10/3/2005 -0.0536 -0.0012 0.03913 -0.1163 11/1/2005 0.02147 0.08038 0.06047 0.03888 12/1/2005 0.01204 -0.0551 0.0057 -0.032 1/3/2006 0.02832 0.0763 -0.0418 0.11713 2/1/2006 0.01175 -0.0421 0.03685 -0.0488 3/1/2006 -0.0385 0.01266 0.00415 0.02504 4/3/2006 0.01585 -0.1125 0.0961 0.03655 5/1/2006 -0.0682 -0.0586 -0.0205 -0.0295 6/1/2006 0.02492 0.02853 -0.006 0.00716 7/3/2006 0.01653 0.03274 .07117 0.10423 8/1/2006 0.10142 0.07221 0.00972 0.00346 9/1/2006 0.00122 0.06407 0.04073 -0.0083 10/2/2006 0.02794 0.04979 0.00559 0.06439 11/1/2006 -0.0095 0.0261 0.01005 0.08007 12/1/2006 0.02352 0.0172 -0.0085 -0.0023 1/3/2007 0.0333 0.04192 0.00384 -0.0405 For questions (b), (c), and (d), we assume that investors invest in the risk-free asset and 4 risky assets (PG, Microsoft, BAC, and Exxon). 35 37 (b) Find the optimal investment portfolio in the risky assets. What are the mean and s.d. of the returns of this portfolio? 56 57 59