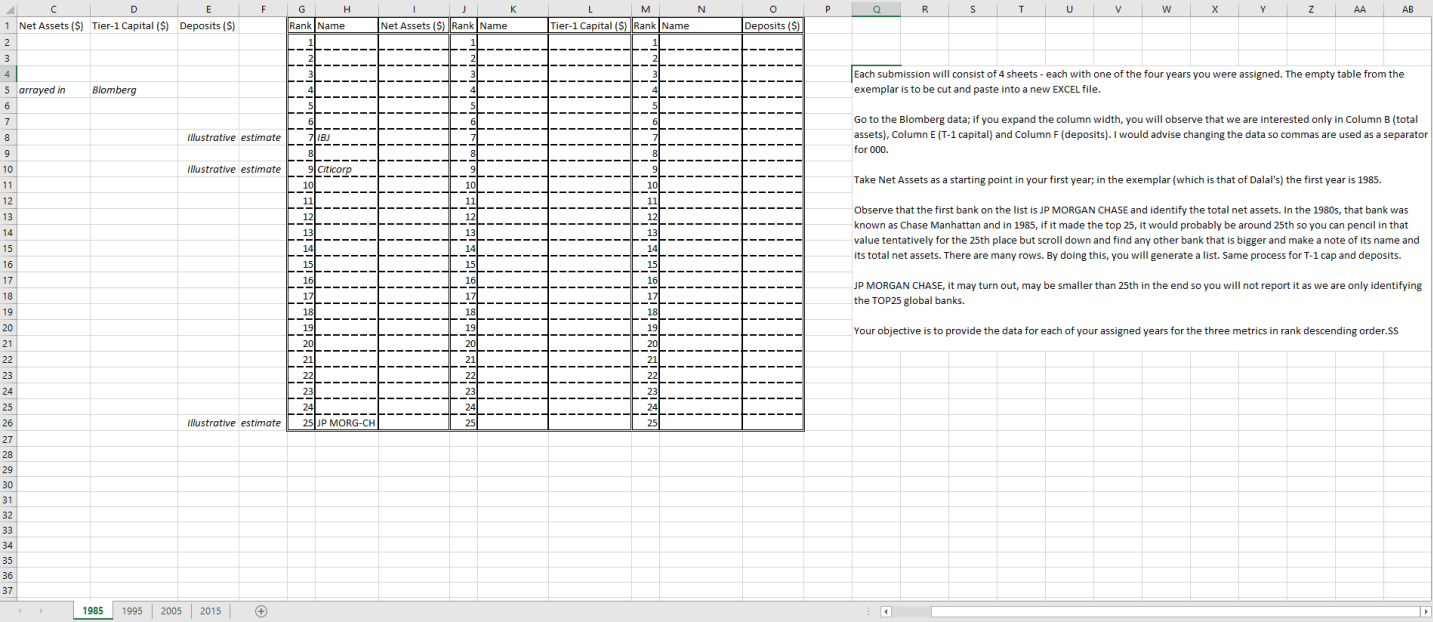
F K N P Q R R S U v w Y Z AA AB D D E 1 Net Assets ($) Tier-1 Capital ($) Deposits ($) 2 G H Rank Name L M M Tier-1 Capital ($) Rank Name Net Assets (S) Rank Name Deposits ($) 3 Each submission will consist of 4 sheets - each with one of the four years you were assigned. The empty table from the exemplar is to be cut and paste into a new EXCEL file. Blomberg 4 5 arrayed in 6 7 8 Illustrative estimate Go to the Blomberg data; if you expand the column width, you will observe that we are interested only in Column B (total assets), Column E (T-1 capital) and Column F (deposits). I would advise changing the data so commas are used as a separator for 000. 9 9 10 Illustrative estimate Take Net Assets as a starting point in your first year; in the exemplar (which is that of Dalal's) the first year is 1985. 11 19 12 13 12 14 Citicorp 10 11 12 13 Observe that the first bank on the list is JP MORGAN CHASE and identify the total net assets. In the 1980s, that bank was known as Chase Manhattan and in 1985, if it made the top 25, it would probably be around 25th so you can pencil in that value tentatively for the 25th place but scroll down and find any other bank that is bigger and make a note of its name and its total net assets. There are many rows. By doing this, you will generate a list. Same process for T-1 cap and deposits. 15 14 15 16 JP MORGAN CHASE, it may turn out, may be smaller than 25th in the end so you will not report it as we are only identifying the TOP 25 global banks. 19 Your objective is to provide the data for each of your assigned years for the three metrics in rank descending order.SS 20 16 17 17 18 19 19 20 21 21 22 23 24 25 20 26 27 28 29 30 31 32 33 34 35 36 37 22 23 24 25 JP MORG-CH Illustrative estimate 1985 1995 2005 2015 F K N P Q R R S U v w Y Z AA AB D D E 1 Net Assets ($) Tier-1 Capital ($) Deposits ($) 2 G H Rank Name L M M Tier-1 Capital ($) Rank Name Net Assets (S) Rank Name Deposits ($) 3 Each submission will consist of 4 sheets - each with one of the four years you were assigned. The empty table from the exemplar is to be cut and paste into a new EXCEL file. Blomberg 4 5 arrayed in 6 7 8 Illustrative estimate Go to the Blomberg data; if you expand the column width, you will observe that we are interested only in Column B (total assets), Column E (T-1 capital) and Column F (deposits). I would advise changing the data so commas are used as a separator for 000. 9 9 10 Illustrative estimate Take Net Assets as a starting point in your first year; in the exemplar (which is that of Dalal's) the first year is 1985. 11 19 12 13 12 14 Citicorp 10 11 12 13 Observe that the first bank on the list is JP MORGAN CHASE and identify the total net assets. In the 1980s, that bank was known as Chase Manhattan and in 1985, if it made the top 25, it would probably be around 25th so you can pencil in that value tentatively for the 25th place but scroll down and find any other bank that is bigger and make a note of its name and its total net assets. There are many rows. By doing this, you will generate a list. Same process for T-1 cap and deposits. 15 14 15 16 JP MORGAN CHASE, it may turn out, may be smaller than 25th in the end so you will not report it as we are only identifying the TOP 25 global banks. 19 Your objective is to provide the data for each of your assigned years for the three metrics in rank descending order.SS 20 16 17 17 18 19 19 20 21 21 22 23 24 25 20 26 27 28 29 30 31 32 33 34 35 36 37 22 23 24 25 JP MORG-CH Illustrative estimate 1985 1995 2005 2015