Answered step by step
Verified Expert Solution
Question
1 Approved Answer
F. Luchessi Inc. F. Luchessi Inc. Income Statement Comparative Balance Sheets For years ended December 31, 2017 and 2018 December 31, 2018 and 2017 2018
| F. Luchessi Inc. | F. Luchessi Inc. | ||||||
| Income Statement | Comparative Balance Sheets | ||||||
| For years ended December 31, 2017 and 2018 | December 31, 2018 and 2017 | ||||||
| 2018 | 2017 | Change | |||||
| 2018 | 2017 | Current assets: | |||||
| Sales (all on credit) | $619,000 | $588,000 | Cash | $62,730 | $32,100 | $30,630 | |
| Cost of goods sold | (345,000) | (283,000) | Accounts receivable (net) | 43,000 | 36,000 | 7,000 | |
| Gross margin | 274,000 | 305,000 | Inventory | 48,000 | 46,000 | 2,000 | |
| Prepaid expenses | 1,600 | 3,500 | -1,900 | ||||
| Depreciation expense | 37,000 | 52,000 | Other current assets | 2,230 | 3,400 | -1,170 | |
| Other operating expenses | 132,000 | 110,000 | Total current assets | 157,560 | 121,000 | 36,560 | |
| Total operating expenses | 169,000 | 162,000 | |||||
| Operating income | 105,000 | 143,000 | Long-term Investments | 86,000 | 60,000 | 26,000 | |
| Other income (expenses) | Plant assets | 312,000 | 261,000 | 51,000 | |||
| Interest expense | (5,000) | (3,700) | Less: accumulated depreciation | (78,600) | (52,000) | 26,600 | |
| Gain on sale of investments | 6,300 | 4,400 | Total plant assets | 233,400 | 209,000 | 24,400 | |
| Loss on sale of plant assets | (3,500) | (4,200) | Total assets | 476,960 | 390,000 | 86,960 | |
| Total other income (expenses) | (14,800) | (3,500) | |||||
| Current liabilities: | |||||||
| Income before income taxes | 102,800 | 139,500 | Accounts payable | $29,400 | $30,000 | $-600 | |
| Income taxes expense | (30,840) | (41,850) | Accrued liabilities | 7,200 | 6,000 | 1,200 | |
| Net income | $71,960 | $97,650 | Income taxes payable | 2,400 | 9,000 | -6,600 | |
| Total current liabilities | 39,000 | 45,000 | -6,000 | ||||
| F. Luchessi Inc. | Long term liabilities: | ||||||
| Statement of Retained Earnings | Notes Payable | 249,000 | 185,000 | 64,000 | |||
| For the year ended December 31, 2018 | Total liabilities | 288,000 | 230,000 | 58,000 | |||
| 2018 | 2017 | ||||||
| Ret. earnings, Jan. 1 | $35,000 | $0 | Stockholders' equity | ||||
| Add: net income | 71,960 | 97,650 | Common stock, $5 par value | 100,000 | 100,000 | 0 | |
| Deduct: Dividends | (43,000) | (62,650) | Additional paid-in capital | 25,000 | 25,000 | 0 | |
| Increase in retained earnings | 28,960 | 35,000 | Retained earnings | 63,960 | 35,000 | 28,960 | |
| Ret. earnings, Dec. 31 | $63,960 | $35,000 | Total stockholders’ equity | 188,960 | 160,000 | 28,960 | |
| Total liabilities and stockholders’ equity | $476,960 | $390,000 | $86,960 | ||||
| Other information: | |||||||
| Shares of common stock outstanding | 20,000 | 20,000 | |||||
| Earnings per share | $3.6 | $4.88 | |||||
| Dividends per share | $2.15 | $3.13 | |||||
| Market price per share, common stock | $16 | $13 | |||||


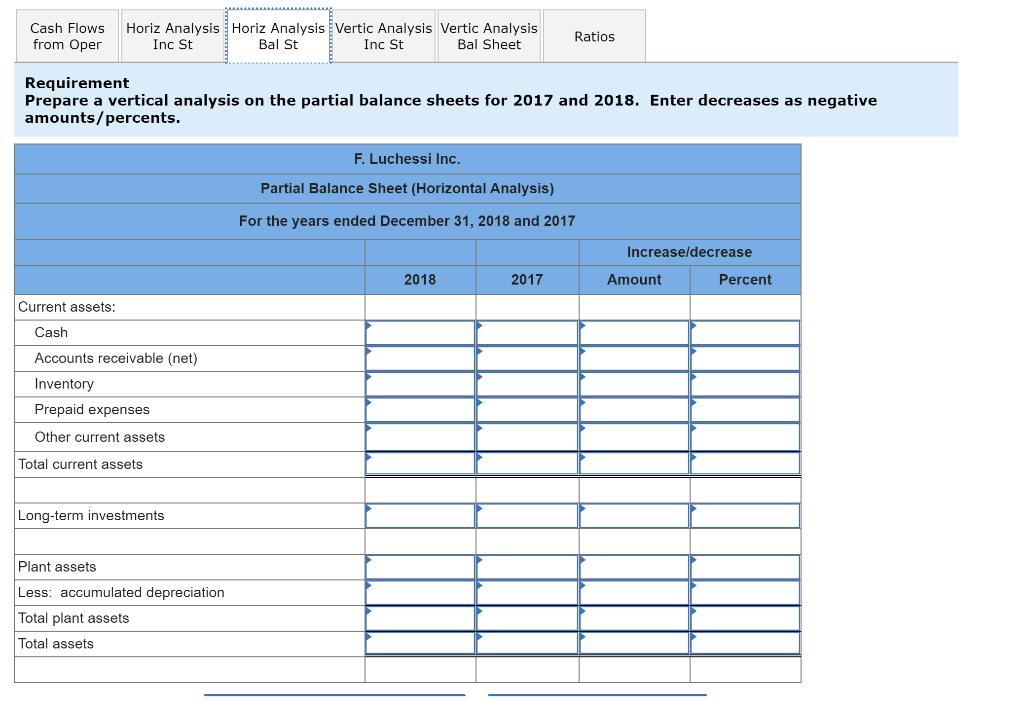
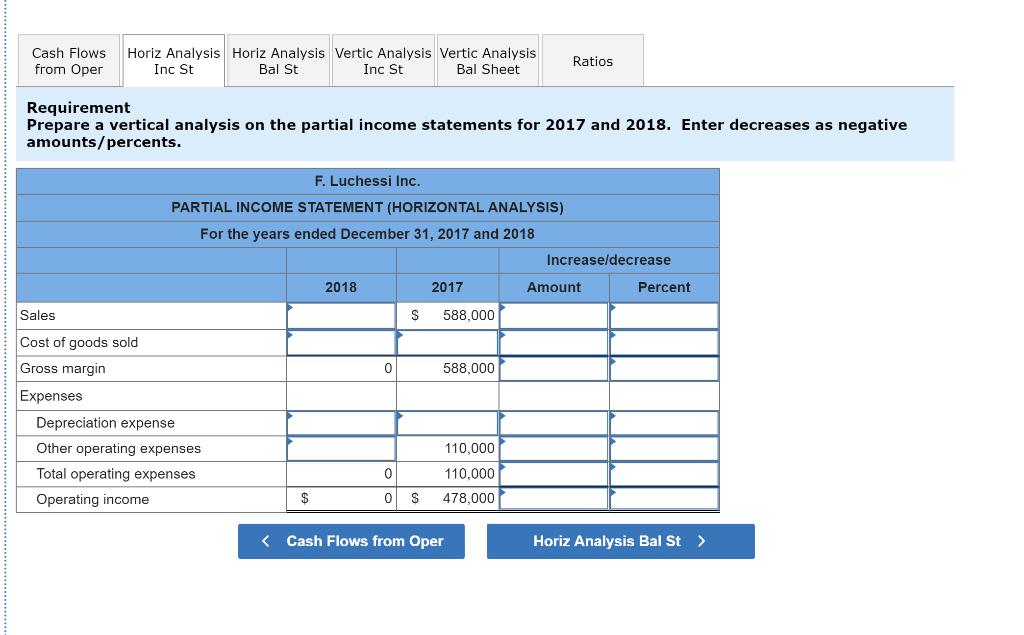
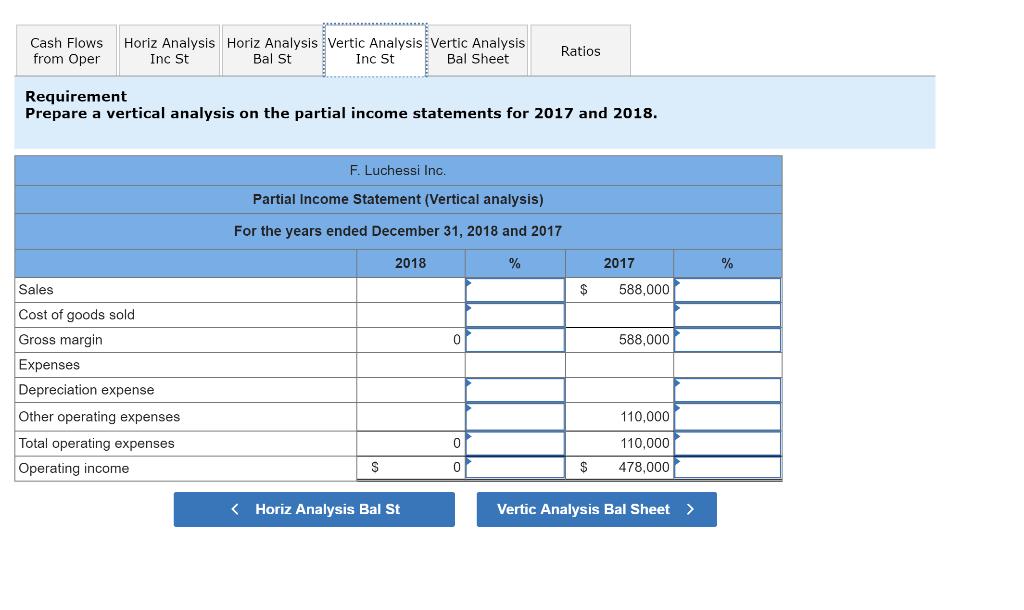
Cash Flows Horiz Analysis Horiz Analysis Vertic Analysis Vertic Analysis Ratios from Oper Inc St. Bal St. Inc St Bal Sheet Requirement Prepare a vertical analysis on the partial balance sheets for 2017 and 2018. Enter decreases as negative amounts/percents. Current assets: Cash Accounts receivable (net) Inventory Prepaid expenses Other current assets Total current assets Long-term investments Plant assets Less: accumulated depreciation Total plant assets Total assets F. Luchessi Inc. Partial Balance Sheet (Horizontal Analysis) For the years ended December 31, 2018 and 2017 2018 2017 Increase/decrease Amount Percent Cash Flows Horiz Analysis Horiz Analysis Vertic Analysis Vertic Analysis from Oper Bal Sheet Inc St Bal St. Inc St Requirement Prepare a vertical analysis on the partial income statements for 2017 and 2018. Enter decreases as negative amounts/percents. Sales Cost of goods sold Gross margin Expenses F. Luchessi Inc. PARTIAL INCOME STATEMENT (HORIZONTAL ANALYSIS) For the years ended December 31, 2017 and 2018 Depreciation expense Other operating expenses Total operating expenses Operating income $ 2018 0 2017 $ 588,000 0 0 $ 588,000 110,000 110,000 478,000 Ratios < Cash Flows from Oper Increase/decrease Amount Percent Horiz Analysis Bal St > Cash Flows Horiz Analysis Horiz Analysis Vertic Analysis Vertic Analysis Ratios from Oper Inc St Bal St. Inc St Bal Sheet Requirement Prepare a vertical analysis on the partial income statements for 2017 and 2018. Sales Cost of goods sold Gross margin Expenses Depreciation expense Other operating expenses Total operating expenses Operating income F. Luchessi Inc. Partial Income Statement (Vertical analysis) For the years ended December 31, 2018 and 2017 S 2018 < Horiz Analysis Bal St 0 0 0 % $ $ 2017 588,000 588,000 110,000 110,000 478,000 Vertic Analysis Bal Sheet > %
Step by Step Solution
★★★★★
3.43 Rating (150 Votes )
There are 3 Steps involved in it
Step: 1
Horizon Analysis of Income statement Increasedecrease 2018 2017 Amount Sales 619000 588000 31000 527 Cost of goods sold 345000 283000 62000 2191 Gross ...
Get Instant Access to Expert-Tailored Solutions
See step-by-step solutions with expert insights and AI powered tools for academic success
Step: 2

Step: 3

Ace Your Homework with AI
Get the answers you need in no time with our AI-driven, step-by-step assistance
Get Started


