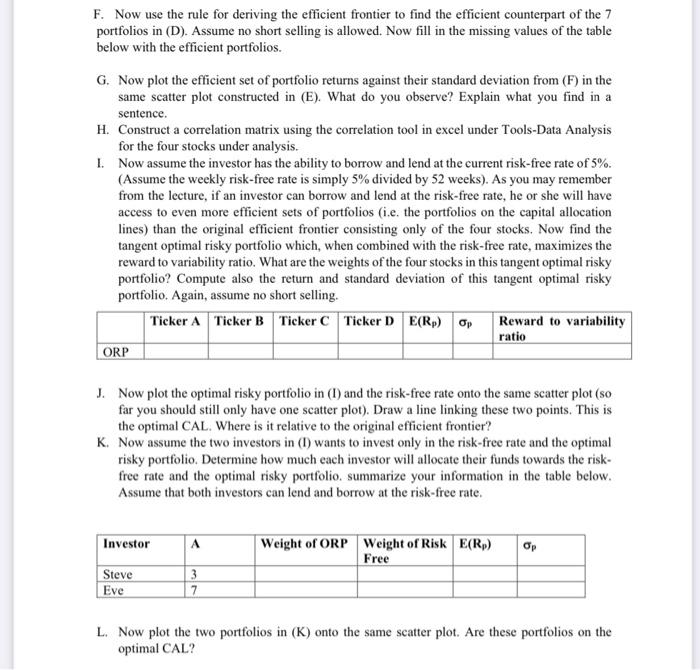
F. Now use the rule for deriving the efficient frontier to find the efficient counterpart of the 7 portfolios in (D). Assume no short selling is allowed. Now fill in the missing values of the table below with the efficient portfolios. G. Now plot the efficient set of portfolio returns against their standard deviation from (F) in the same scatter plot constructed in (E). What do you observe? Explain what you find in a sentence. H. Construct a correlation matrix using the correlation tool in excel under Tools-Data Analysis for the four stocks under analysis. 1. Now assume the investor has the ability to borrow and lend at the current risk-free rate of 5%. (Assume the weekly risk-free rate is simply 5% divided by 52 weeks). As you may remember from the lecture, if an investor can borrow and lend at the risk-free rate, he or she will have access to even more efficient sets of portfolios (i.e. the portfolios on the capital allocation lines) than the original efficient frontier consisting only of the four stocks. Now find the tangent optimal risky portfolio which, when combined with the risk-free rate, maximizes the reward to variability ratio. What are the weights of the four stocks in this tangent optimal risky portfolio? Compute also the return and standard deviation of this tangent optimal risky portfolio. Again, assume no short selling. Ticker A Ticker B Ticker C Ticker D E(R) Op Reward to variability ratio ORP J. Now plot the optimal risky portfolio in (1) and the risk-free rate onto the same scatter plot (so far you should still only have one scatter plot). Draw a line linking these two points. This is the optimal CAL. Where is it relative to the original efficient frontier? K. Now assume the two investors in (1) wants to invest only in the risk-free rate and the optimal risky portfolio. Determine how much each investor will allocate their funds towards the risk- free rate and the optimal risky portfolio. summarize your information in the table below. Assume that both investors can lend and borrow at the risk-free rate. Investor A Weight of ORP Weight of Risk E(R) Free Op Steve Eve 3 7 L. Now plot the two portfolios in (K) onto the same scatter plot. Are these portfolios on the optimal CAL? F. Now use the rule for deriving the efficient frontier to find the efficient counterpart of the 7 portfolios in (D). Assume no short selling is allowed. Now fill in the missing values of the table below with the efficient portfolios. G. Now plot the efficient set of portfolio returns against their standard deviation from (F) in the same scatter plot constructed in (E). What do you observe? Explain what you find in a sentence. H. Construct a correlation matrix using the correlation tool in excel under Tools-Data Analysis for the four stocks under analysis. 1. Now assume the investor has the ability to borrow and lend at the current risk-free rate of 5%. (Assume the weekly risk-free rate is simply 5% divided by 52 weeks). As you may remember from the lecture, if an investor can borrow and lend at the risk-free rate, he or she will have access to even more efficient sets of portfolios (i.e. the portfolios on the capital allocation lines) than the original efficient frontier consisting only of the four stocks. Now find the tangent optimal risky portfolio which, when combined with the risk-free rate, maximizes the reward to variability ratio. What are the weights of the four stocks in this tangent optimal risky portfolio? Compute also the return and standard deviation of this tangent optimal risky portfolio. Again, assume no short selling. Ticker A Ticker B Ticker C Ticker D E(R) Op Reward to variability ratio ORP J. Now plot the optimal risky portfolio in (1) and the risk-free rate onto the same scatter plot (so far you should still only have one scatter plot). Draw a line linking these two points. This is the optimal CAL. Where is it relative to the original efficient frontier? K. Now assume the two investors in (1) wants to invest only in the risk-free rate and the optimal risky portfolio. Determine how much each investor will allocate their funds towards the risk- free rate and the optimal risky portfolio. summarize your information in the table below. Assume that both investors can lend and borrow at the risk-free rate. Investor A Weight of ORP Weight of Risk E(R) Free Op Steve Eve 3 7 L. Now plot the two portfolios in (K) onto the same scatter plot. Are these portfolios on the optimal CAL