

Answered step by step
Verified Expert Solution
Question
1 Approved Answer
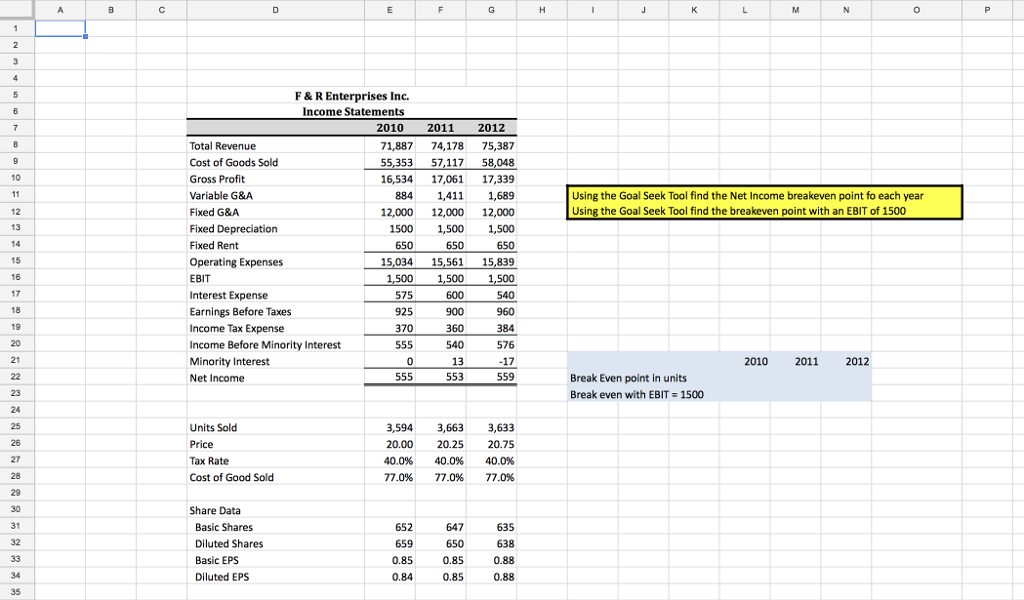
F & R Enterprises Inc. Income Statements 2010 2011 2012 Total Revenue Cost of Goods Sold Gross Profit Variable G&A Fixed G&A Fixed Depreciation Fixed
Step by Step Solution
There are 3 Steps involved in it
Step: 1

Get Instant Access to Expert-Tailored Solutions
See step-by-step solutions with expert insights and AI powered tools for academic success
Step: 2

Step: 3
Ace Your Homework with AI
Get the answers you need in no time with our AI-driven, step-by-step assistance
Get Started
Financial Services Sales Handbook A Professionals Guide To Becoming A Top Producer
Authors: Clifton T. Warren
1st Edition
1631574930, 978-1631574931