

Answered step by step
Verified Expert Solution
Question
1 Approved Answer
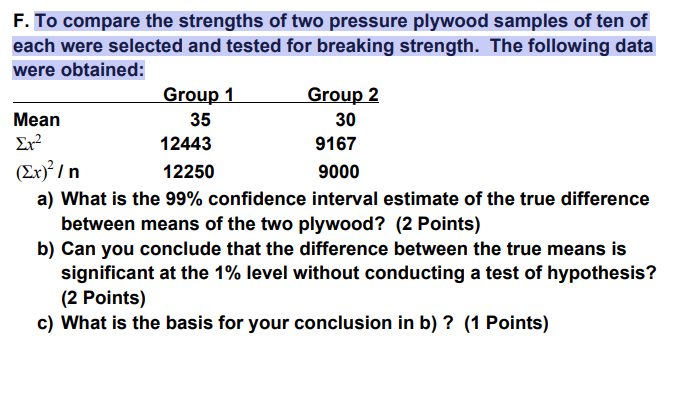
F. To compare the strengths of two pressure plywood samples of ten of each were selected and tested for breaking strength. The following data were
Step by Step Solution
There are 3 Steps involved in it
Step: 1

Get Instant Access to Expert-Tailored Solutions
See step-by-step solutions with expert insights and AI powered tools for academic success
Step: 2

Step: 3
Ace Your Homework with AI
Get the answers you need in no time with our AI-driven, step-by-step assistance
Get Started
Business Analytics Data Analysis and Decision Making
Authors: S. Christian Albright, Wayne L. Winston
5th edition
1133629601, 9781285965529 , 978-1133629603