

Question
f) What is ADI's TTM PEG? g) What is ADI's TTM Dividend Yield? h) What is ADI's TTM Dividend Payout Ratio? i) What is ADI's
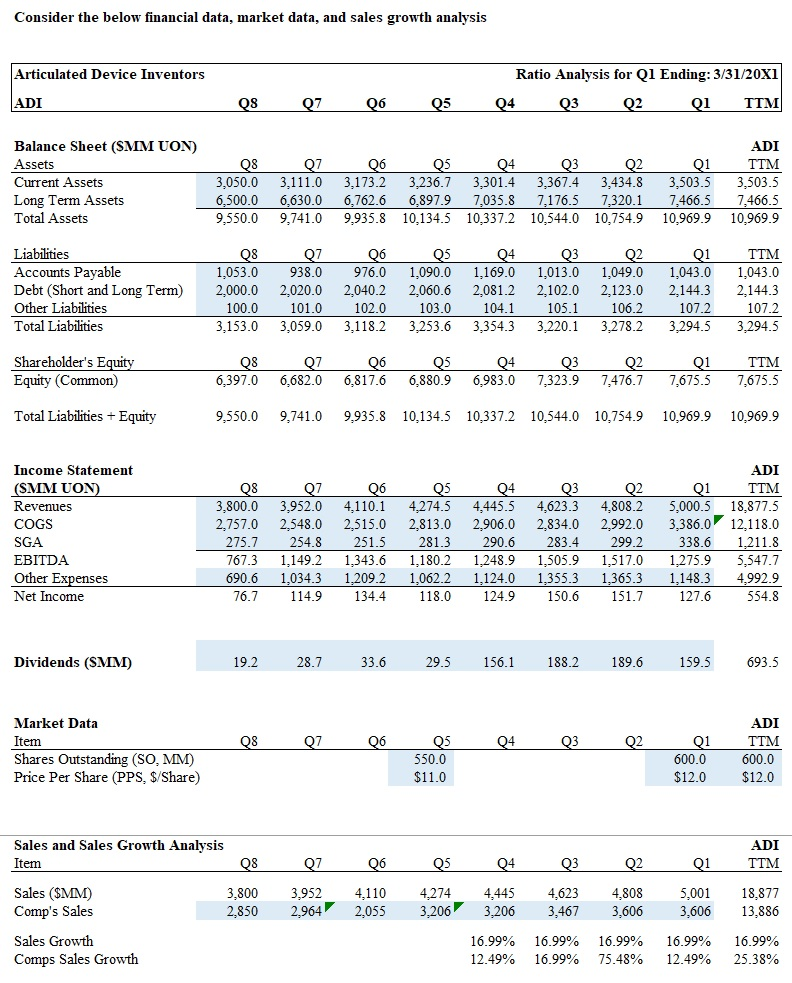 f) What is ADI's TTM PEG?
g) What is ADI's TTM Dividend Yield?
h) What is ADI's TTM Dividend Payout Ratio?
i) What is ADI's TTM Debt/(Enterprise Value)?
j) What is ADI's TTM Debt/Capitalization?
k) What is ADI's TTM EV/EBITDA?
Consider the below financial data, market data, and sales growth analysis Articulated Device Inventors Ratio Analysis for Q1 Ending: 3/31/20X1 04 03 02 01 TTM ADI 08 07 06 05 Balance Sheet (SMM UON) Assets Current Assets Long Term Assets Total Assets 08 3,050.0 6,500.0 9,550.0 07 3.111.0 6,630.0 9,741.0 06 3.173.2 6,762.6 9,935.8 05 3.236.7 6,897.9 10,134.5 04 3,301.4 7,035.8 10,337.2 03 3,367.4 7.176.5 10,544.0 02 3,434.8 7.320.1 10,754.9 01 3,503.5 7,466.5 10,969.9 ADI TTM 3,503.5 7,466.5 10,969.9 Liabilities Accounts Payable Debt (Short and Long Term) Other Liabilities Total Liabilities 08 1,053.0 2,000.0 100.0 3.153.0 07 938.0 2,020.0 101.0 3.059.0 06 976. 0 2,040.2 102.0 3.118.2 05 1,090.0 2,060.6 103.0 3.253.6 04 1.169.0 2,081.2 104.1 3,354.3 03 1,013.0 2,102. 0 105.1 3.220.1 02 1,049.0 2.123.0 106.2 3.278.2 01 1,043.0 2.144.3 107.2 3.294.5 TTM 1,043.0 2.144.3 107.2 3.294.5 Shareholder's Equity Equity (Common) 08 6.397.0 07 6,682.0 06 6,817.6 05 6,880.9 04 6,983.0 03 7,323.9 02 7.476.7 01 7,675.5 TIM 7,675.5 Total Liabilities + Equity 9,550.0 9,741.0 9.935.8 10.134.5 10.337.2 10,544.0 10.754.9 10.969.9 10.969.9 Income Statement (SMM UON) Revenues COGS SGA EBITDA Other Expenses Net Income 08 3,800.0 2,757.0 275.7 767.3 690.6 76.7 07 3.952.0 2,548.0 254. 8 1.149.2 1.034.3 114.9 06 4.110.1 2,515.0 251.5 1,343.6 1.209. 2 134.4 05 4,274.5 2,813.0 281.3 1.180.2 1,062.2 118.0 04 4,445.5 2,906.0 290.6 1.248.9 1,124.0 124.9 03 4,623.3 2,834.0 283. 4 1,505.9 1,355.3 150.6 02 4,808.2 2,992.0 299.2 1,517,0 1,365.3 151.7 01 5,000.5 3,386,0 338.6 1,275.9 1,148.3 127.6 ADI TTM 18.877.5 12,118.0 1.211.8 5,547.7 4,992.9 554.8 Dividends (SMM) 19.2 28.7 33.6 29.5 156.1 188.2 189.6 159.5 693.5 ADI Market Data Item Shares Outstanding (SO, MM) Price Per Share (PPS, $/Share) 08 07 06 05 04 03 02 01 TTM 550.0 $11.0 600.0 $12.0 600.0 $12.0 Sales and Sales Growth Analysis Item Q8 Sales ($MM) 3.800 Comp's Sales 2,850 07 06 3.9524,110 2.964 2,055 05 4,274 3.206 04 4,445 3.206 Q3 4.623 3,467 Q2 Q1 4,8085,001 3,606 3,606 ADI TTM 18,877 13,886 Sales Growth Comps Sales Growth 16.99% 12.49% 16.99% 16.99% 16.99% 75.48% 16.99% 12.49% 16.99% 25.38%Step by Step Solution
There are 3 Steps involved in it
Step: 1

Get Instant Access to Expert-Tailored Solutions
See step-by-step solutions with expert insights and AI powered tools for academic success
Step: 2

Step: 3
Ace Your Homework with AI
Get the answers you need in no time with our AI-driven, step-by-step assistance
Get Started
Fundamentals of Financial Management
Authors: Eugene F. Brigham, Joel F. Houston
Concise 6th Edition
324664559, 978-0324664553