

Answered step by step
Verified Expert Solution
Question
1 Approved Answer
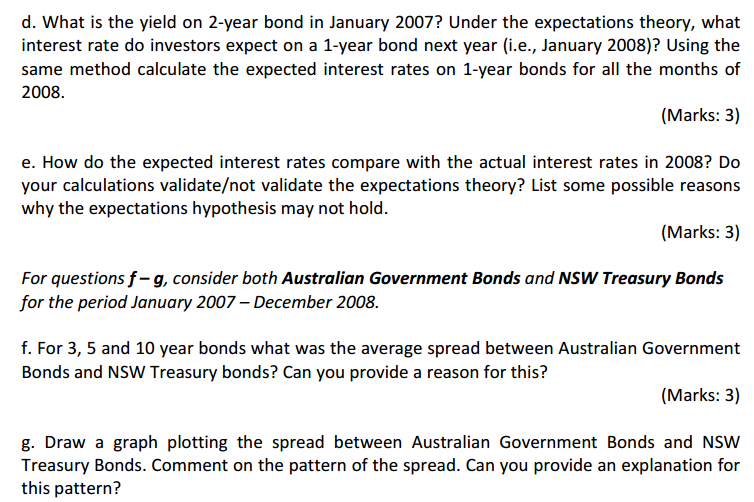
F2 CAPITAL MARKET YIELDS - GOVERNMENT BONDS Per cent per annum Australian Federal Government NSW Treasury Years to Maturity Years to Maturity Date 0 yrs
| F2 CAPITAL MARKET YIELDS - GOVERNMENT BONDS | |||||||||
| Per cent per annum | |||||||||
| Australian Federal Government | NSW Treasury | ||||||||
| Years to Maturity | Years to Maturity | ||||||||
| Date | 0 yrs | 1 yrs | 2 yrs | 3 yrs | 5 yrs | 10 yrs | 3 yrs | 5 yrs | 10 yrs |
| Jan-2007 | 6.25 | 6.26 | 6.18 | 6.11 | 6.05 | 5.88 | 6.33 | 6.28 | 6.17 |
| Feb-2007 | 6.25 | 6.23 | 6.08 | 6.02 | 5.97 | 5.81 | 6.24 | 6.19 | 6.09 |
| Mar-2007 | 6.25 | 6.45 | 6.12 | 6.04 | 5.95 | 5.74 | 6.27 | 6.19 | 6.03 |
| Apr-2007 | 6.25 | 6.30 | 6.25 | 6.19 | 6.11 | 5.91 | 6.42 | 6.35 | 6.19 |
| May-2007 | 6.25 | 6.35 | 6.19 | 6.15 | 6.07 | 5.92 | 6.38 | 6.32 | 6.21 |
| Jun-2007 | 6.25 | 6.50 | 6.40 | 6.39 | 6.34 | 6.20 | 6.66 | 6.66 | 6.56 |
| Jul-2007 | 6.25 | 6.57 | 6.38 | 6.38 | 6.30 | 6.15 | 6.68 | 6.71 | 6.62 |
| Aug-2007 | 6.50 | 6.52 | 6.29 | 6.24 | 6.13 | 5.93 | 6.64 | 6.62 | 6.46 |
| Sep-2007 | 6.50 | 6.55 | 6.32 | 6.29 | 6.21 | 5.99 | 6.73 | 6.70 | 6.52 |
| Oct-2007 | 6.50 | 6.86 | 6.58 | 6.56 | 6.45 | 6.17 | 6.93 | 6.87 | 6.66 |
| Nov-2007 | 6.75 | 6.83 | 6.67 | 6.57 | 6.36 | 6.03 | 7.15 | 7.01 | 6.66 |
| Dec-2007 | 6.75 | 6.86 | 6.72 | 6.66 | 6.46 | 6.21 | 7.18 | 7.09 | 6.76 |
| Jan-2008 | 6.75 | 6.83 | 6.61 | 6.58 | 6.34 | 6.08 | 6.99 | 6.92 | 6.58 |
| Feb-2008 | 7.00 | 7.12 | 6.82 | 6.75 | 6.50 | 6.29 | 7.33 | 7.26 | 6.96 |
| Mar-2008 | 7.25 | 7.03 | 6.30 | 6.21 | 6.10 | 6.09 | 6.94 | 6.90 | 6.82 |
| Apr-2008 | 7.25 | 7.21 | 6.33 | 6.25 | 6.19 | 6.17 | 6.89 | 6.84 | 6.78 |
| May-2008 | 7.25 | 7.35 | 6.60 | 6.47 | 6.33 | 6.36 | 7.02 | 6.91 | 6.89 |
| Jun-2008 | 7.25 | 7.26 | 6.97 | 6.84 | 6.69 | 6.59 | 7.36 | 7.23 | 7.10 |
| Jul-2008 | 7.25 | 6.87 | 6.64 | 6.49 | 6.40 | 6.37 | 7.14 | 7.05 | 7.01 |
| Aug-2008 | 7.25 | 6.34 | 5.83 | 5.74 | 5.77 | 5.86 | 6.35 | 6.38 | 6.49 |
| Sep-2008 | 7.00 | 5.63 | 5.51 | 5.48 | 5.54 | 5.65 | 6.21 | 6.24 | 6.33 |
| Oct-2008 | 6.00 | 4.33 | 4.35 | 4.59 | 4.83 | 5.22 | 5.27 | 5.48 | 5.85 |
| Nov-2008 | 5.25 | 3.09 | 3.64 | 3.96 | 4.28 | 4.94 | 4.75 | 5.14 | 5.69 |
| Dec-2008 | 4.25 | 2.67 | 3.07 | 3.43 | 3.72 | 4.22 | 4.54 | 4.87 | 5.12 |
Step by Step Solution
There are 3 Steps involved in it
Step: 1

Get Instant Access to Expert-Tailored Solutions
See step-by-step solutions with expert insights and AI powered tools for academic success
Step: 2

Step: 3
Ace Your Homework with AI
Get the answers you need in no time with our AI-driven, step-by-step assistance
Get Started
Pricing And Hedging Financial Derivatives A Guide For Practitioners
Authors: Leonardo Marroni, Irene Perdomo
1st Edition
1119953715, 978-1119953715